Color Modification of Spinel by Nickel (Ni) Diffusion: A New Treatment in the Gem Market
February 10, 2023

In November 2022, a parcel of 24 approximately 0.5–1.2 ct spinel crystals, described as cobalt-diffused, were obtained directly from a treater by the research team at GIA in Bangkok. Of these, seven possessed the deep blue color characteristic of cobalt diffusion, while the others showed lighter blue, greenish blue, bluish green, or blue-green color (figure 1). Slabs were cut from the core of several of these crystals, and all showed diffuse color zonation, from more blue/green at the rims to near-colorless at the cores.
The concentrations of various elements were measured along culet-to-table transects in the slabs using laser ablation–inductively coupled plasma–mass spectrometry (LA-ICP-MS). The expectation was that all crystals would show simple cobalt (Co) diffusion profiles, meaning high cobalt concentrations at the crystal edge, changing gradually to lower concentrations in the crystal core. This has been well described by Saeseaw et al. (2015). For the deep blue crystals, the result was as expected: high cobalt, thousands of atomic parts per million (ppma) at the crystal edge, changing gradually to low cobalt in the crystal core. This is clear evidence of cobalt diffusion treatment. However, all other crystals (i.e., those that were not deep blue) showed something quite different. The cobalt concentration in these crystals was negligible, generally below a few atomic ppm. The nickel (Ni) concentration, conversely, was extremely elevated, around 5,000 to 30,000 ppma at the rim and dropping to a few ppma in the crystal core. An initial conclusion was made that these “cobalt-diffused” spinel crystals were not cobalt-diffused at all, but rather nickel-diffused. Subsequent investigations using various absorption, luminescence, and fluorescence techniques, along with gemological observations, confirmed that the samples were indeed nickel-diffused and that natural spinel was used as the starting material. Additionally, nickel was confirmed to be the main chromophore responsible for the modified color. These observations are described in detail below, along with recommended identification criteria.
GEMOLOGICAL OBSERVATIONS
A total of 18 stones were studied. Standard gemological testing was consistent for spinel. Refractive indices were generally 1.718, but some samples varied up to 1.721, possibly due to the increased concentration of nickel at the surface. All samples were inert in long-wave UV light. Most were inert to short-wave UV, but a few showed faint chalky yellow fluorescence near the edges when prepared as doubly polished slabs. All faceted stones had a weak to strong red reaction when viewed through the Chelsea color filter. The doubly polished slabs viewed in this way showed color zonation: red at the rims and colorless in the centers.
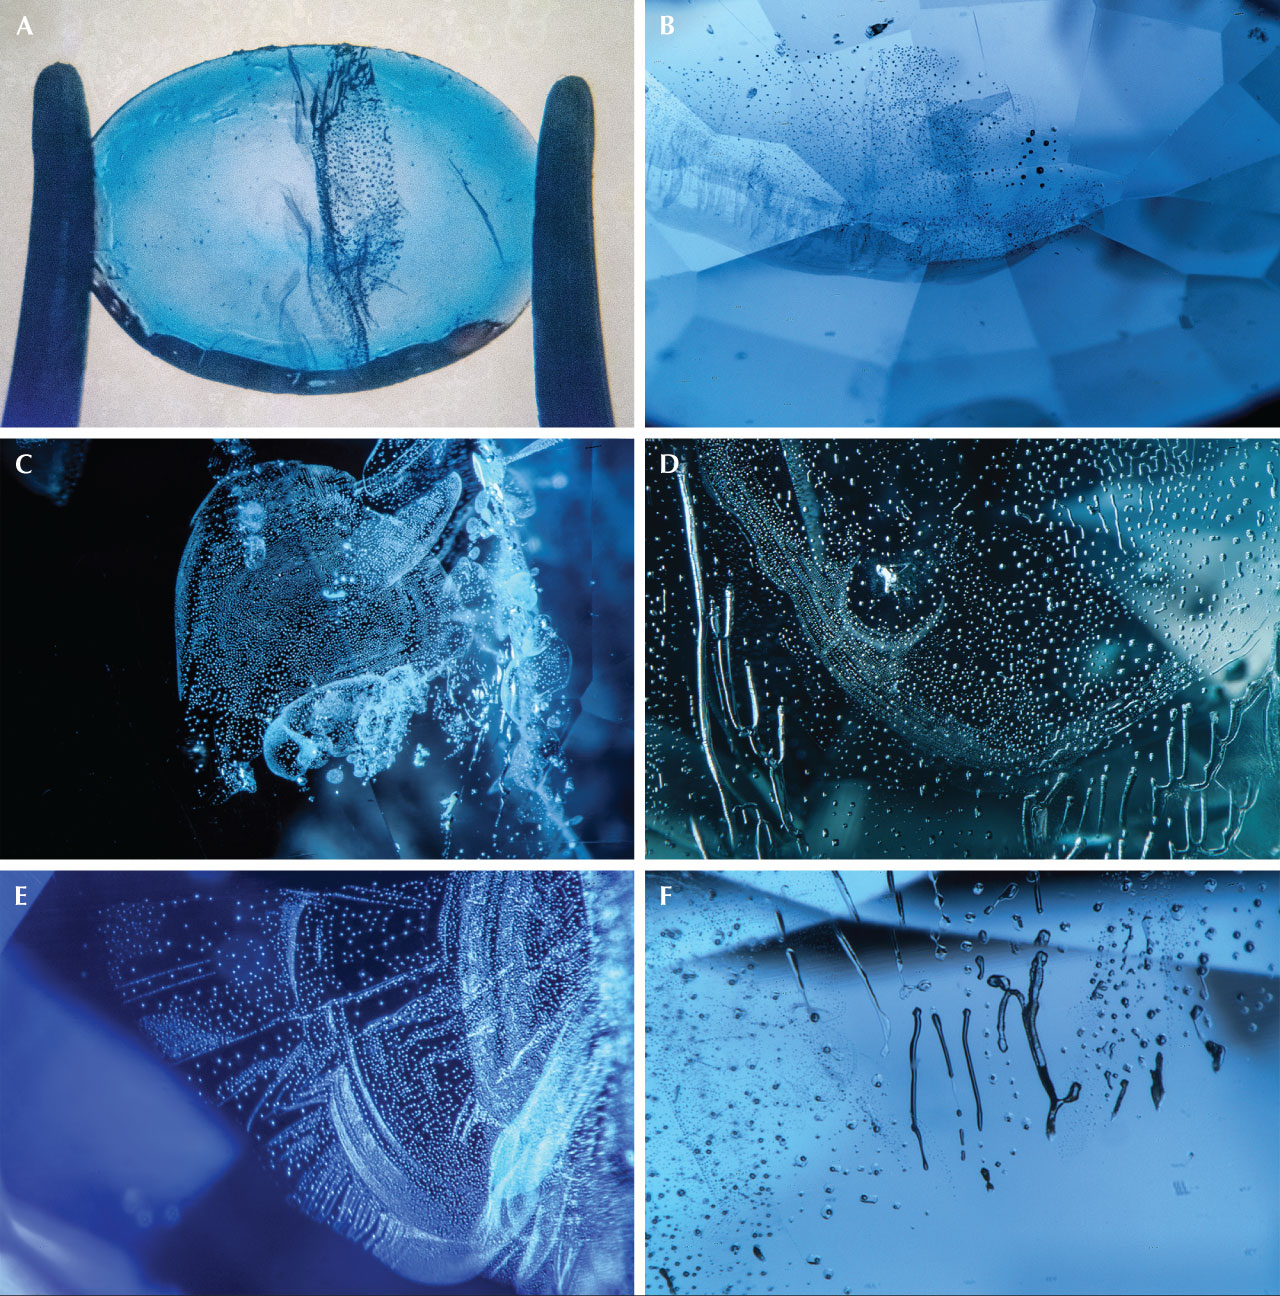
When immersed in methylene iodide, the faceted stones showed a strong concentration of color around the rim of the stone, sometimes with additional subtle color concentration along the facet junctions (figure 2A). Microscopic observations sometimes showed this same color concentration along facet junctions, particularly at the keel of the stones (figure 2B), although the effect was more subtle than seen in other treated material, such as titanium-diffused sapphire. The most striking microscopic feature was the abundance of artificially healed fractures, likely associated with the presence of a flux material during the heating (figure 2, C–F). This is also supported by the trace element data, described below, which show high amounts of lithium at the crystal edge—lithium is a common component of flux material.
TRACE AND MINOR ELEMENT CONCENTRATIONS AND PROFILES
Even without quantification, the high nickel concentrations are obvious in X-ray fluorescence spectra (figure 3). These show clear peaks associated with nickel, with the main peak being the Kα emission line at around 7.47 keV. No samples from this suite showed fluorescence associated with cobalt.


The concentration of nickel at the edge of the crystals was high, around 10000–30000 ppma (table 1), as measured using LA-ICP-MS spot analyses on the girdles of 13 stones. These nickel concentrations are very high when compared to natural gem-quality spinel submitted for analyses at GIA (figure 4A). It should be noted, however, that end-member nickel-spinel (chihmingite, NiAl2O4) has been found in nature.
Along with elevated nickel, some but not all crystals also showed high lithium (Li) concentrations, up to around 3000 ppma. Such high lithium is rare in natural, untreated gem spinel (figure 4B). Concentrations of other elements, even if added or removed during the diffusion treatment, were generally within normal ranges for gem spinel. Notably, this also includes beryllium (Be, figure 4C), despite beryllium showing increasing concentration toward the crystal edge in the LA-ICP-MS transect, described below (figure 5).

Additionally, the concentrations of all other measured elements were highly variable between stones. This implies either different treatment conditions or different starting materials. Preliminary analyses from the cores of some doubly polished slabs (not presented) showed different concentrations of elements other than Ni (those analyzed in table 1) in areas apparently unaffected by diffusion, suggesting that these concentration differences relate at least partially to different starting materials rather than different treatment conditions. At this point, however, we cannot confidently describe the nature of the starting materials.
Overall, the data show that nickel is a weak chromophore, as thousands to tens of thousands of ppma led to relatively weak colors. In contrast, cobalt diffusion treatment requires only a few hundred to thousands of ppma cobalt to create deep blue colors.

In the crystal where trace element concentrations were recorded along a central transect (sample 17407124), nickel, lithium, beryllium, zinc (Zn), manganese (Mn), and cobalt show decreasing concentrations from the rim to the core (figure 5). All show U-shaped profiles. Ni shows the largest concentration change, from ~1 ppma in the core to ~5000 ppma at the rim. Cobalt shows the smallest change, from ~0.4 ppma at the core to ~0.8 ppma at the rim. Conversely, vanadium (V), iron (Fe), and magnesium (Mg) show inverted U-shaped profiles—i.e., lower concentrations at the rim than at the core—although the Mg profile cannot be accurately resolved using our LA-ICP-MS method. The Mg profile can be resolved using energy-dispersive spectroscopy (EDS), though, as described below. Chromium (Cr) and titanium (Ti) show variable concentrations, but neither show clear U-shaped or inverted U-shaped profiles. Gallium (Ga) shows no apparent concentration change.

A central portion of another doubly polished slab (sample 17407069) was also mapped using EDS (figure 6), to complement the data from LA-ICP-MS analyses. This method has considerably higher spatial resolution than LA-ICP-MS but suffers from much poorer detection limits, so the only elements in the spinel that could be measured were nickel, magnesium (Mg), aluminum (Al), and oxygen (O). Nickel shows a clear concentration decrease from rim to core. Magnesium shows the opposite, and aluminum shows no apparent zonation. The zonation pattern of nickel conforms to the faceted stone’s shape, which implies that the diffusion treatment was conducted after faceting. This is consistent with the presence of color concentration at facet junctions.

ULTRAVIOLET/VISIBLE SPECTROSCOPY
Ultraviolet/visible (UV-Vis) spectra were recorded from the rims of several double-polished slabs (17407057, 17407126, 17407123, 17407124), using a 0.5 mm circular aperture. In all cases, the main peaks were at 369, 381, 475, 597, and 639 nm (figure 7). These positions are consistent with those present in spectra recorded from nickel-doped spinel powders synthesized for use as cyan dyes (Serment et al., 2020), nickel-doped single crystal spinel (Jouini et al., 2007), and nickel-doped gahnite spinel (ZnAl2O4; Lorenzi et al., 2006).
The peaks at 597 and 639 nm were assigned in this study to nickel in tetrahedral coordination (i.e., nickel generally replacing Mg2+). The peaks at 369 and 381 nm were associated with nickel in octahedral coordination, meaning nickel generally replacing Al3+. The band at 475 nm was not specifically defined by Serment et al. (2020), but it is notable that stones with a more intense 475 nm band appear to show a more green color. Figure 7 also shows a spectrum recorded from a cobalt-diffused spinel, obtained in the same parcel as these nickel-diffused crystals, showing clearly different absorption band positions.
The similarity between the absorption spectra from the nickel-diffused crystals, and a spectrum of single-crystal nickel-doped spinel grown in an argon atmosphere, suggests that the nickel is predominantly Ni2+, which would also likely be favored over Ni3+ at the high temperatures of diffusion treatment (likely 1600°C or higher).

PHOTOLUMINESCENCE SPECTROSCOPY
Photoluminescence (PL) spectra recorded with 514 nm excitation are shown in figure 8. Spectra of the nickel-diffused stones are similar to natural, heat-treated spinel, which is in line with visual observations of inclusions and refractive indices. As with most natural spinel, the spectra are dominated by bands attributed to chromium. The spectra show broadening of the band(s) at around 686 nm. PL spectra recorded near the crystal rims are different from those recorded in the cores, with the rim spectra showing a dominant band at 687.5 nm, and core spectra showing a strong doublet with maxima at 685.6 and 687.3 nm. This may be associated with nickel, but it is notable that a spectrum recorded from a natural, unheated spinel with relatively high nickel (around 350 ppma) did not clearly show this feature. Spectra recorded from faceted stones using non-confocal PL spectroscopy will likely show some combination of these spectra.
DIFFUSION RATES AND MECHANISMS
The length scales over which the concentrations of the diffusing elements change, defined as the characteristic diffusion length, increases in the order V<Mn<Fe<Zn≈Co≈Ni<Be<Li (figure 5), suggesting a similar order for the relative diffusion coefficients. In other words, lithium diffuses more rapidly than vanadium.
The decrease in magnesium concentration from the core of the crystal to the edge (figure 6), associated with an increase in nickel concentration, is consistent with nickel addition associated with the removal of magnesium from the crystal. This would imply that the nickel primarily occupies the crystallographic site usually occupied by magnesium—i.e., the tetrahedral site in spinel. This is consistent with the UV-Vis spectra, where all crystals show predominantly tetrahedral nickel. Additionally, this is the expected mechanism of nickel incorporation, because the ionic radii for Ni2+ and Mg2+ are similar: 0.55 and 0.57 Å respectively (Shannon, 1976).
Some also show nickel in octahedral coordination, implying nickel on the aluminum site. This is expected at the high temperatures of diffusion treatment, which are unknown but possibly >1500°C. At these temperatures, spinel becomes disordered, meaning cations swap between sites.
The shapes of nickel diffusion profiles—i.e., the forms of concentration versus distance data in figure 5—correspond almost perfectly to the error function, a mathematical function often used to describe the shapes of diffusion profiles. Simply, this means that there is a smooth decrease in nickel concentration, and associated color, from the edge of a crystal to the core. This implies that diffusion in this system is relatively simple, with little or no trapping behavior—such non-simple behavior could be expressed as sharp color changes, as is often observed in titanium-diffused sapphires, for example. The likely diffusion mechanism would then involve simple exchange of Mg (tetrahedral) vacancies with Ni2+, which has been proposed as one mechanism of Cr3+ diffusion in spinel (Posner et al., 2016).
SUMMARY OF CRITERIA FOR IDENTIFICATION
According to our current study of these stones, the following criteria are proposed for identification of nickel diffusion treatment in spinel:
- High concentrations of nickel at the crystal faces, potentially thousands of atomic parts per million or more. This may be associated with high lithium concentrations.
- Photoluminescence spectra characteristic of heated, natural spinel, although the possibility of treatment of lab-grown spinel is not ruled out.
- Characteristic UV-Vis absorption spectra, with bands at around 370, 470, and 600 nm.
- Subtle color concentrations at the facet junctions, although this may be limited if the stones are repolished after treatment.
- Textures associated with flux-assisted healing of fractures.
Overall, the treatment should be readily identifiable using standard gemological techniques and equipment.
Dr. Michael Jollands, Abadie Ludlam, Pamela Cevallos, Sarah Arden, Elina Myagkaya, and Dr. Ulrika D’Haenens-Johannson are researchers with GIA in New York. Dr. Aaron Palke, Dr. Shiyun Jin, and Ziyin Sun are with GIA in Carlsbad. Wim Vertriest and Vararut Weeramongkhonlert are with GIA in Bangkok.
Jouini A., Yoshikawa A., Guyot Y., Brenier A., Fukuda T., Boulon G. (2007) Potential candidate for new tunable solid-state laser between 1 and 2μm: Ni2+-doped MgAl2O4 spinel grown by the micro-pulling-down method. Optical Materials, Vol. 30, No. 1, pp. 47–49, http://dx.doi.org/10.1016/j.optmat.2006.11.027
Lorenzi G., Baldi G., Di Benedetto F., Faso V., Lattanzi P., Romanelli M. (2006) Spectroscopic study of a Ni-bearing gahnite pigment. Journal of the European Ceramic Society, Vol. 26, No. 3, pp. 317–321, http://dx.doi.org/10.1016/j.jeurceramsoc.2004.10.027
Posner E.S., Ganguly J., Hervig R. (2016) Diffusion kinetics of Cr in spinel: Experimental studies and implications for 53Mn–53Cr cosmochronology. Geochimica et Cosmochimica Acta, Vol. 175, pp. 20–35, http://dx.doi.org/10.1016/j.gca.2015.11.018
Saeseaw S., Weeramonkhonlert V., Khowpong C., Ng-Pooresatien N., Sangsawong S., Raynaud V., Ito C. (2015) Cobalt diffusion of natural spinel: A report describing a new treatment on the gem market. GIA News from Research, June 3, https://www.gia.edu/doc/Cobalt-Diffusion-in-Spinel-v2.pdf
Serment B., Gaudon M., Demourgues A., Noël A., Fleury G., Cloutet E., Hadziioannou G., Brochon C. (2020) Cyan Ni1–xAl2+2x/3□x/3O4 single-phase pigment synthesis and modification for electrophoretic ink formulation. ACS Omega, Vol. 5, No. 3, pp. 18651–18661, http://dx.doi.org/10.1021/acsomega.0c01289
Shannon R. (1976) Revised effective ionic radii and systematic studies of interatomic distances in halides and chalcogenides. Acta Crystallographica Section A: Crystal Physics, Diffraction, Theoretical and General Crystallography, Vol. 32, No. 5, pp. 751–767, http://dx.doi.org/10.1107/S0567739476001551