


Abstract
Pollinators are an essential component of terrestrial food webs and agricultural systems but are threatened by insufficient access to floral resources. Managed honey bees, as generalist foragers that hoard nectar as honey, can act as bioindicators of floral resources available to pollinators in a given landscape through their accumulation of honey. Honey yields across the United States have decreased appreciably since the 1990s, concurrent with shifts in climate, land-use, and large-scale pesticide application. While many factors can affect honey accumulation, this suggests that anthropogenic stressors may be having large-scale impacts on the floral resources that pollinators depend on for their nutrition. We used hierarchical partitioning on five decades of state-level data to parse the most important environmental factors and likely mechanisms associated with spatial and temporal variation in honey yields across the US. Climatic conditions and soil productivity were among the most important variables for estimating honey yields, with states in warm or cool regions with productive soils having the highest honey yields per colony. These findings suggest that foundational factors constrain pollinator habitat suitability and define ecoregions of low or high honey production. The most important temporally varying factors were change in herbicide use, land use (i.e. increase in intensive agriculture and reduction in land conservation programs that support pollinators) and annual weather anomalies. This study provides insights into the interplay between broad abiotic conditions and fine temporal variation on habitat suitability for honey bees and other pollinators. Our results also provide a baseline for investigating how these factors influence floral resource availability, which is essential to developing strategies for resilient plant–pollinator communities in the face of global change.
Export citation and abstract BibTeX RIS

Original content from this work may be used under the terms of the Creative Commons Attribution 4.0 license. Any further distribution of this work must maintain attribution to the author(s) and the title of the work, journal citation and DOI.
1. Introduction
Flowering plants and pollinators form mutualistic relationships which are vital for terrestrial ecosystems: as pollinators collect nectar and pollen from flowering plants as their main source of nutrition, they support seed and fruit set in their host plants [1]. Ecoregions can vary in their capacity to support pollinators, as regional climate and soil characteristics determine what plant communities can grow in different locations as well as the success of those plants [3–5]. Global change, however, can reduce habitat suitability and threatens plant–pollinator mutualisms in numerous ways [6–9]. It is well established that anthropogenic land use change reduces floral availability [10, 11] and that land use intensification, notably increased use of pesticides, particularly herbicides, diminishes floral resource quality [12]. There is also growing recognition that changing weather patterns associated with climate change pose a threat to the quality, quantity, and phenological availability of flowers [13, 14]. However, due to limited monitoring across sufficient spatial and temporal scales, it is difficult to understand how ecoregional conditions, land use change, and weather interact to influence floral resources available [15, 16]. This limits our ability to prepare for a resilient future amidst a changing world.
Lack of high quality floral resources is considered one of the primary stressors to pollinators [17, 18]. Bees' primary source of nutrition is pollen and nectar from flowers, and there is great interest in quantifying floral resources to identify bee-supportive landscapes and to enhance landscape management [19, 20]. Empirical estimates of landscape-level floral resources are extremely labor intensive and often unable to sufficiently account resource quality (e.g. nectar volume) [19]. Honey bee (Apis mellifera) colonies are uniquely suited as a sentinel for monitoring long-term, broad scale environmental effects on floral resources [21–23]. Honey bees store abundant nectar resources as honey and recruit nestmates to high quality resources [24], are generalist foragers whose dietary niche overlaps with many specialist and generalist pollinators, and are capable of foraging over long distances [25]. Additionally, as managed pollinators, honey bees have other needs met by the beekeeper (e.g. nesting resources), enabling more direct assessment of nutritional resources. Thus, honey accumulation can be used to quantify the effects of landscape-level stressors on floral resource availability.
While multiple regional and global change factors impact the abundance, diversity, and resource quality of flowering plants, few studies assess these impacts simultaneously to determine their relative impact and likely mechanism. Our objective in this study was to distill the spatial (regional) and temporal (change) effects of climate, soil productivity, land use, and herbicide use on honey bee colony productivity, to reveal potential drivers of floral resource availability using five decades of honey yield data from across the United States (figure 1) (United States Department of Agriculture-National Agricultural Statistics Service (USDA-NASS)). Though this USDA-NASS data is only available at a course, state level, the spatial and temporal extent provides a unique opportunity to understand broad-scale patterns. We hypothesize that variation in honey yields can be explained in large part by ecoregional factors such as climate and soil, while anthropogenic change factors (habitat conversion and intensification) will account for declining honey yields over the past several decades. Understanding the spatiotemporal trends in honey yields across the US over the last half century provides a baseline that will allow for enhanced predictions and targeted studies of floral resources to support managed honey bees, wild pollinator communities, and their pollination services amid an ever-changing environment. These findings can also help inform beekeeping practices, target land management experiments, and prioritize the most important locations for these experiments and interventions to support biodiversity and ecosystem services.

Figure 1. Conceptual diagram illustrating the environmental filtering process influencing pollinator floral resource availability. As one moves up the pyramid, environmental factors act at finer spatial and temporal scales and further filter floral resource availability. Spatial factors are shown to the left in pink boxes and temporal factors are shown in blue boxes. At the foundation of the pyramid is ecoregion suitability (characterized by climate and soil productivity), followed by habitat availability (characterized by land use and annual land use change), and habitat quality (characterized by herbicide use, herbicide use change, and annual weather). Adapted from [2].
Download figure:
Standard image High-resolution image2. Methods
2.1. Data sources and pre-processing
Data on average honey yield per colony, land use, herbicide use, climate, weather anomalies, and soil productivity in the continental United States were obtained from multiple open-source repositories and varied in their temporal extent, temporal resolution, and spatial resolution (table 1). In supplement 1 we provide detailed explanation for our choice of data to represent each of these environmental stressors. Briefly, spatial variation in land use among states was represented in our models by soybeans, a proxy for intensive agriculture that is typically considered non-bee-supportive, and Conservation Reserve Program (CRP) land, a national conservation program that has been shown to support pollinators [26, 27]. We hypothesized that land use and land use conversion from CRP land (the largest on-farm conservation program) to soybean land (the most abundant agricultural crop by area), as well as soybean intensification, (i.e. glyphosate, the most abundant herbicide used on soybeans, and overall in agriculture, by weight) would represent broad trends in land management over the past several decades and capture loss of weedy floral resources in crop margins. Additionally, climate (i.e. temperature and precipitation) and soil productivity may help characterize floral ecoregions, while annual deviations from climate normal (i.e. weather anomalies) may underly floral resource quality (i.e. nectar quantity) [13]. We also assessed the potentially confounding effect of colony abundance on honey yields, finding no effect and thus excluding this variable in subsequent analyses (supplement 2). Due to limitations in data availability, we are unable to answer all questions related to honey production but feel that our carefully chosen environmental variables shed light on bee floral resource dynamics across the US over the last 50 years.
Table 1. Description of data sources for each variable included in analysis of honey yields in the United States from 1974 to 2020, including temporal extent, temporal resolution, spatial resolution, data summary with units (mean, standard error, and range). While some values of the explanatory variables are small relative to others (e.g. CRP, glyphosate use), these values are representative of the system as they summarize data from across the US over several decades. Variables were scaled and centered prior to analysis to put them on the same scale.
| Variable | Description | Data source | Temporal extent | Temporal resolution | Spatial resolution | Data summary mean ± se; (min–max) |
|---|---|---|---|---|---|---|
| Honey yield | Average yield of honey per colony based on stratified sampling of beekeepers with >5 colonies | USDA-NASS [28] accessed: 9 August 2021 | 1974–1981; 1986–2020 | Annual | State | 28.7 ± 0.3 kg colony−1; (8.6–62.6) |
| Soybean area | Acres of harvested soybean, converted to proportion of state area, available for 31 of 48 contiguous states | USDA-NASS [29–31] accessed: 9 August 2021 | 1974–2020 | Annual | State | 7.3 ± 0.3%; (0.01–30) |
| Conservation Reserve Program (CRP) | Enrolled acres of all CRP (as opposed to only those with pollinator-specific management goals) for the program's entire duration (1986–2019), converted to proportion of state area | USDA-FSA [32] accessed: 10 August 2021 | 1986–2019 | Annual | State | 0.02 ± 0.05%; (0–0.07) |
| Glyphosate use on soybean | Weight of glyphosate applied to soybean; low estimate used (high estimates also available). To approximate application rate, application weight was divided by the total area of harvested soybeans | USGS Pesticide National Synthesis Project [33] accessed: 30 November 2021 | 1992–2019 | Annual | State | 0.4 ± 0.01 kg/acre; (0–1.2) |
| Temperature | Annual mean temperature | PRISM [34, 35] accessed: 4 August 2021 | 1974–1981 1986–2020 | Annual | 4 km | 12.8 ± 0.1 °C; (4.9–21.8) |
| Precipitation | Total annual precipitation | PRISM [34, 35] accessed: 4 August 2021 | 1974–1981 1986–2020 | Annual | 4 km | 1089.1 ± 9.7 mm; (491.4–1520.5) |
| Soil productivity index | Ordinal index, ranging from 0 to 19, with 19 representing the most productive soils. Classification is based upon soil taxonomy and features that are commonly associated with soil productivity | USDA-Forest Service [36, 37] accessed: 9 August 2021 | Updated in 2020 | NA (does not change over time) | 240 m | 8.3 ± 0.1 index (3.7–13.7) |
All data processing and analysis was completed in R version 3.6.3 [38]. To match the state-level resolution available for honey yield data, more granular raster data were averaged to the state level using the raster (v.3.4.5) [39] and exactextractr (v.0.6.1) [40] packages. We stratified our analysis into separate models: pre- and post-1992 (1974–1991, 1992–2019) to match the temporal extent of different data sources [41]. Glyphosate data and CRP data were only available post-1992; thus the post-1992 model utilizes the full set of variables while the pre-1992 model is a reduced model. This also approximated the periods when colonies were generally increasing in productivity and decreasing in productivity, respectively (figure 2).
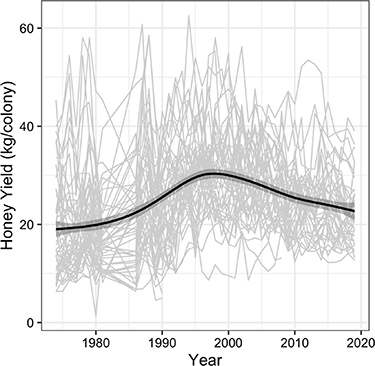
Figure 2. Average honey yield (kg colony−1) among colonies in the United States from 1974–2020, with light gray lines showing reported yields for each state over time and the dark line showing a loess smooth with shaded confidence interval to help visualize the temporal trend. Data were not reported for 1982–1985.
Download figure:
Standard image High-resolution image2.2. Statistical analysis
We fit generalized linear mixed effects model (GLMM) in JAGS using R2jags (v.0.7.1) [42] with an identity link function and normal error distributions. For each of these models we examined estimated effect sizes for each of our covariates of interest and used hierarchical partitioning to assess the relative contribution of different groups of factors to the explained variation in honey yield [41]. Hierarchical partitioning assesses relative variable importance based upon the improvement in log likelihood associated with the addition or removal of each group of covariates among an exhaustive series of hierarchically organized regression models [43]. In this way, explained variation can be assessed for each set of variables, independent of other proposed covariates [43]. This is particularly useful in cases such as ours, where variables are correlated (supplement figure S1). Before fitting models, each dependent and independent variable was scaled and centered to assist with model convergence and to enable parameter estimate comparisons of variables on different scales (due to units or biological reasons). Prior to scaling, average proportion of soybean and CRP land, as well as honey yield, our dependent variable, were square root transformed to correct for skew.
Within each model (pre-1992 and post-1992), spatial variation was characterized by calculating the state-level average for each predictor (across all years, within each time period), while temporal variation was characterized by the annual deviation from the state-level average [44, 45]. For example, average temperature in each state from 1992 to 2021 (i.e. 'climate') is a spatial predictor, while the annual deviations from those values (i.e. 'weather anomalies') is a temporal predictor (supplement table S1).
The set of models included in the hierarchical partitioning included the full model of all spatial and temporal predictors, all nested subset models, and a null model with no fixed effects (supplement table S1). Predictors were functionally grouped into soil productivity, land use (soybean and CRP land), herbicide use, herbicide use change, land use change (soybean and CRP land), annual weather anomalies (temperature and precipitation) and climate (temperature and precipitation). Visualizing the relationship between climate and honey yield suggested a quadratic relationship, so we also included their squared terms. This resulted in five sets of variables for a total of 30 nested models in the pre-1992 hierarchical partitioning, and seven sets of variables (addition of herbicide use and herbicide use change) in the post-1992 hierarchical partitioning, for a total of 126 nested models. We did not include random effects in any of the hierarchical partitioning models to ensure the explained variation was solely attributable to the fixed effects. However, when reporting estimates from the full model, we include a random intercept of state and year. We assessed model fit for both full models using Bayesian p-values for the mean and coefficient of variation (standard deviation divided by the mean) of new, simulated values of honey yield, compared to observed values of honey yield [46, 47].

We used minimally informative priors for our parameters; means were normally distributed and centered around zero with small precision Normal(0, 0.001), and vague, uniformly distributed standard deviations Uniform(0,100). We fit three chains for each model, each with 10 000 iterations monitored after a burn-in of 2000 iterations and thinned at an interval of 5.
3. Results
Honey yield per colony were generally increasing from the mid-1970's to early 1990's but decreased precipitously since the early 1990's (figure 2). However, general patterns in regional productivity have remained consistent across time, with states in the Northern Great Plains and along the Gulf Coast consistently producing the greatest honey yields per colony across years (supplement figure S2). In both periods we assessed (pre- and post-1992), sources of spatial variation across states (climate, soil productivity, proportion of soybean or conservation land, and herbicide use) were much more important than sources of temporal variation in each state (weather anomalies, changes proportion of soybean or conservation land, changes in herbicide use) (figure 3). Our full model provided accurate estimates of honey yields (supplement figure S3) and post predictive checks showed that our data was consistent with the fitted model (i.e. all Bayesian p-values fell within 0.1–0.9, with three of the four p-values = 0.5).
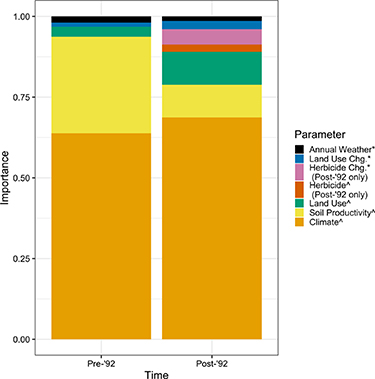
Figure 3. Parameter importance to describing honey yield, before and after 1992. Parameters are variables or groups of variables assessed using hierarchical partitioning. We compared spatial (denoted by ^ in legend) versus temporal parameters (denoted by * in legend). The herbicide parameters were only assessed in the post-1992 models when data became available.
Download figure:
Standard image High-resolution image3.1. Sources of spatial variation in honey yields
For both the pre- and post-1992 data, spatial variation in climate was the most important factor for describing spatial trends in honey yields, followed by soil productivity, and then land use (figure 3). In the pre- and post-1992 models, 64% and 69% of explained variance was attributable to climate, respectively. Soil productivity also accounted for a large proportion of explained variance, with 30% in the pre-1992 model and 10% in the post-1992 model. In the pre-1992 model, state-level land use only accounted for 3% of the explained variance, as compared to 10% in the post-1992 model. In the post-1992 model, average state-level herbicide use was only marginally important, at 2%; data on herbicide use was not available for pre-1992.
The highest honey yields were seen in states with either cool or warm climates and high soil productivity (figure 4). In our full model for both the pre-1992 data (μlinear = −0.02 ± 0.09, 95% credible interval (CI) = −0.17–0.21; μquad = 0.46 ± 0.07, 95% CI = 0.31–0.60), and post-1992 data (μlinear = −0.12 ± 0.13, 95% CI = −0.14–0.40; μquad = 0.59 ± 0.13, 95% CI = 0.31–0.84) there was strong evidence for a parabolic relationship between climate-average temperature and honey yield (figure 4). In both periods, there was also a positive correlation between honey yield and soil productivity (pre-1992: μ = 0.37 ± 0.11, 95% CI = 0.15–0.59; post-1992: μ = 0.36 ± 0.22, 95% CI = −0.07–0.78). The model predicted an approximate 50% increase in yield from the lowest to the highest productivity values (range = 3.7–13.7) in both the pre- and post-1992 models (figure 4). Climate variables and soil productivity alone yielded very good estimates of honey yield during each period, when comparing actual versus model-fitted values (pre-1992 model: ρ = 0.87, R2 = 0.77; post-1992 model: ρ = 0.83, R2 = 0.68) (figure 5).
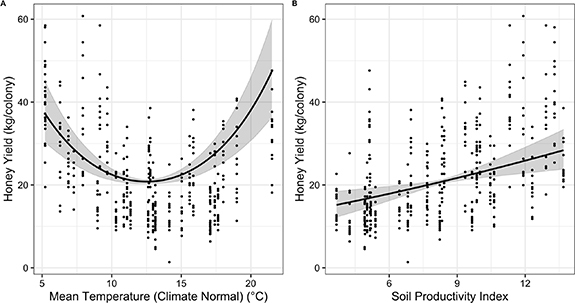
Figure 4. Spatial variation in climate and soil productivity are strongly associated with honey yield. Pre-1992 model estimated trends between honey yields and climate-normal temperature (A) and soil productivity (B) are shown. Trends are shown (black line) with the 95% credible interval (gray), and actual data are plotted as points.
Download figure:
Standard image High-resolution image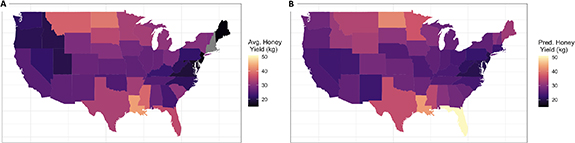
Figure 5. Spatial variation in climate and soil productivity accurately predict honey yield in post 1992 data. Actual average honey yields (A) and estimated honey yield, based on the post-1992 climate and Soil Productivity mean estimates (B) are shown. States are shaded according to honey yield estimates (lighter colors indicating higher honey yields).
Download figure:
Standard image High-resolution image
In the full model for both periods, there was large uncertainty around the effect of land use, and the effects were not sufficiently different from zero. The amount of land used for soybean production in each state did not have an appreciable effect on honey yields in the pre-1992 model (μ = 0.03 ± 0.08, 95% CI = −0.14–0.18), or in the post-1992 model (μ = 0.17 ± 0.15, 95% CI = −0.12–0.46), but there was some evidence of a positive trend. In the post-1992 model, there was large uncertainty around the effect of proportion of CRP land in a state, and the mean estimate was very low (μ=−0.08 ± 0.17, 95% CI = −0.44–0.24). There was also limited evidence for an effect for average state-level herbicide use on average honey yield (μ = 0.15 ± 0.11, 95% CI = −0.06–0.37), with some evidence of a positive trend.
3.2. Sources of temporal variation in honey yields
We next evaluated sources of temporal variation in honey yields within states. Since 1992, and concurrent with declines in honey yields, average temperatures and rainfall have both generally increased, CRP land enrollment area has decreased while soybean area has increased, and there has been a pronounced increase in the glyphosate use (supplement figure S4). Compared to the spatial factors, temporal factors accounted for a smaller proportion of overall explained variation (figure 3). Of these temporal factors, land use change and weather anomalies were of comparable importance for describing honey yields in the pre-1992 data (1% and 2% of total variation explained, respectively). In the post-1992 model, change in herbicide use was the most important temporal factor (5% of total explained variation), followed by land use change (3%) and weather anomalies (1%) (figure 3).
Increasing the proportion of soybean land and decreasing the proportion of CRP land across time were each negatively correlated with honey yield. When the proportion of soybean land in a state increased, our temporal model for the pre-1992 data indicated that honey yield simultaneously decreased (μ= −0.10 ± 0.03, 95% CI = −0.15 to −0.04). In our post-1992 temporal model, however, there was no evidence of an effect of changes in the proportion of soybean land (μ = 0.04 ± 0.03, 95% CI = −0.02–0.09), but there was evidence for lower honey yields associated with a decreasing proportion of CRP land (μ = 0.07 ± 0.03, 95% CI = 0.01–0.13).
While identified as important, we did not detect a strong effect of changing herbicide application rates in the post-1992 model (μ= −0.02 ± 0.05, 95% CI = −0.12–0.09). Our model estimates a 65% probability of a negative correlation between change in herbicide use and change in honey yield. However, this uncertainty likely stems from the inclusion of year as a random effect in the GLMM. Because change in herbicide application rates increased across years (supplement figure S4(F)), including year in the model increases the uncertainty around our fixed effect of changing herbicide application rate.
Though weather anomalies were identified as relatively important in both periods, the only strong evidence for an effect of weather anomalies comes from precipitation anomalies pre-1992. In the pre-1992 model, wetter-than-normal years were associated with lower honey yields (μ= −0.08 ± 0.03, 95% CI = −0.14 to −0.02), but there was little evidence for an effect of annual temperature deviations from normal in this model (μ= −0.04 ± 0.04, 95% CI = −0.12–0.04). Likewise, in the post-1992 model, the 95% credible intervals for annual temperature deviations from normal contained zero (μ= −0.03 ± 0.04, 95% CI = −0.04–0.10), indicating weak evidence of an effect. There was also no evidence for an effect of precipitation anomalies in the post-1992 model (μ = −0.00 ± 0.03, 95% CI = −0.05–0.05).
4. Discussion
We summarize the appreciable decline in honey yields across the continental United States since the mid-1990s, which contrasts with annually increasing yields in the previous decades. There are multiple interacting factors that are thought to affect honey bee colony productivity and pollinators more broadly [17, 18]. We show that over the last five decades, honey yields at the state level, which can be considered a proxy for trends in floral resource availability for both managed and wild pollinators [21, 48], can be explained largely by geographic factors. That is, there are different floral-resource suitability ecoregions across the US characterized by climate conditions and soil productivity. We also demonstrate that changes in honey yields over time within states are associated with changes in herbicide application rates, land use, and annual weather anomalies. These year-to-year changes seem to fine-tune the foundational ecoregional patterns we observed and contribute to better estimates of floral resources.
Warm and cool regions with highly productive soils produce more honey than states with moderate climates and poor soil productivity. Based on the importance of the spatial (ecoregional) coefficients in our hierarchical models, our results suggest a process of environmental filtering. That is, climate and soil productivity set the foundation for the most floral-supportive states, likely by determining the types of floral communities that can grow in a region. Land use, the next most important spatial factor, may further constrain the types of flowers that are available in the landscape. Herbicide use, a proxy for land use quality and additional layer of environmental filtering, was not identified as very important as a spatial predictor in our hierarchical partitioning model, perhaps because it was too far abstracted to have an appreciable effect.
The importance of climate and climate change to pollinators is increasingly recognized as a potential stressor [13, 49, 50]. Our findings likewise indicate that climate is closely associated with honey production, likely through climate effects on floral resources. A recent study on colony productivity across the North Central US likewise identified climate conditions as the most important factor for describing honey bee colony weights, as compared to land use and annual weather [22]. Similar to our findings, the authors describe greater colony weight gain in the cool, dry regions of the study [22]. Warm and cool climates are likely not intrinsically supportive of floral resources. Rather, these climates likely foster regional, bee-supportive floral communities. It is therefore unlikely that these findings could be extrapolated beyond the US, as different regions of the globe have different floral communities that are shaped and differentially affected by climate conditions.
Climate became increasingly important in describing honey yields post-1992, as compared to pre-1992. This difference may reflect regions of the US becoming more distinct with climate change [51]. It is unclear how future shifts in climate will affect key honey-producing regions of the US. If pollinators and plant communities track climate shifts, our model estimates may help predict changes in pollinator-supportive regions of the country under future climate change scenarios. For example, we may expect declining pollinator resources in the Great Plains as climate warms and becomes more moderate, while resources may increase in the mid-Atlantic as conditions become hotter. Given the variable effects of climate change on different floral and pollinator species and cascading effects at different spatial scales, the effects of climate change on plant–pollinator communities are likely much more complex and uncertain [6, 49, 52–54]. Therefore, continued monitoring is necessary to identify thresholds and make predictions as climates become more extreme and stochastic. Because parameter importance is relative to other factors, the apparent increase in the importance of climate post-1992 may instead reflect a decrease in importance of other factors (e.g. soil productivity). However, given the high overall importance of climate on honey yield and given that climate change is expected to exacerbate other pollinator stressors [8], conservation actions that mitigate climate change should be considered for pollinator conservation.
Soil productivity, an underexplored factor in describing landscape suitability for pollinators, was identified as an important spatial factor in our models. To our knowledge, only one previous study has modeled landscape level effects of soils on pollinator floral resources or colony productivity [5]. While previous studies have focused on soil nutrients [4, 5, 55, 56], our findings suggest that soil taxonomic traits (the basis of the soil productivity index) effectively captures the potential of soils to support abundant, productive flowers. One previous study analyzed the effect of various soil characteristics on field-scale grassland productivity by creating a novel index using principal components analysis [57]. These researchers found that their index was positively correlated with floral functional diversity, and in turn with plant–pollinator interactions [57]. The soil productivity index (which we used) has the distinct advantage of being standardized open-source data for researchers and land managers in the US. Furthermore, because it is based on soil taxonomy, similar indices could be developed in countries outside the US with minimal data collection. While we were unable to account for temporal differences in soil productivity, it is known that anthropogenic practices, such as those that result in erosion and excessive drainage, can decrease soil productivity [36], and a recent study showed that anthropogenic soil eutrophication has negative consequences for pollinator communities [5]. Future research is needed to further investigate the effect of soil taxonomy on the quantity and quality of flowers for pollinators. If this is a true effect, practices that retain and restore soil productivity (one of the original objectives of CRP [58]) could be considered for pollinator conservation.
Land use change trends closely matched our expectations, with a decrease in soybean land and an increase in CRP land each having a positive effect on honey yields. Moreover, change in herbicide use application rates was important, which aligns with previous suggestions that flowering weeds in rowcrop agriculture can provide nutrition to bees in intensive landscapes [59]. The role of land use change and intensification on floral availability is a notable finding, given that much of pollinator conservation to date has focused on pollinator habitat restoration. In 2014, the US Pollinator Health Task Force released a memorandum that called for the restoration and/or improvement of seven million acres (2.83 million ha) of pollinator habitat [60]. Conservation Reserve Program land has been shown effective in attracting abundant honey bee and wild bee foragers [26], and when CRP land is present in the local landscape honey bee colonies are more productive [27]. Previous research has raised concern about the effect of land use conversion from CRP land to soybean land and the potential effects on honey bee colonies [10, 61]. Otto et al [10] showed that the Northern Great Plains, a key region for honey productions, had over half of its CRP land converted to annual row crops, including soybeans, between 2006 and 2016. At the country scale, we similarly saw an increase in soybean land and decrease in CRP land in recent decades. Unlike Otto et al [10, 61] however, we did not have the spatial resolution to determine if sampled colonies were within foraging range of CRP land. This lack of granularity is a limitation of our study. Because beekeepers select apiary locations based on perceived landscape quality (e.g. preferring CRP land over crops such as soybeans [10]), our approach may underestimate the importance of land use and land use change. Our finding, along with previous research, suggests that investing in pollinator habitat restoration is a promising approach for enhancing floral resources for pollinators at the landscape scale.
We also provide strong evidence of a negative correlation between higher-than-normal precipitation and honey yields pre-1992. Similar to our findings, a detailed, four-year study in the Michigan, US identified the importance of weather to honey bee colony productivity, and described a negative correlation between higher-than-normal precipitation on honey weight accumulation, which is primarily attributable to honey [62]. The authors attribute this trend to an indirect effect of rainfall on floral communities [62], though we cannot exclude the possibility that these trends also correlate with the bees' ability to forage. Likewise, Calovi et al [63] (2020) found that both high and low precipitation was associated with increased colony mortality in a three-year study in Pennsylvania, US. Extreme precipitation events are expected with climate change [64] and thus continued monitoring could help researchers forecast various climate change scenarios and prepare for a resilient future for pollinators.
Our study demonstrates significant effects of multiple global change factors, from climate and soil productivity to land use change and extreme weather. We suggest that climate and soil productivity underpin floral regions by constraining the available plant communities, while land use and weather modulate the realized floral resources and annual productivity of that community. While large-scale, long-term studies, such as ours, are often limited by data availability, our findings provide valuable insights that can be applied to improve models and design experiments to enable beekeepers to predict honey yields, growers to understand pollination services, and land managers to support plant–pollinator communities and ecosystem services. We call for continued long-term monitoring and manipulative experiments to improve understanding of environmental factors affecting habitat suitability for pollinators across space and time. Our findings reinforce pervious findings on the detrimental effect of land use conversion from bee-supportive habitats to intensive agricultural land use and highlight soil conservation as an area for further consideration as a pollinator conservation practice. These long term, broad scale observational trends should be explored further at local scales, and with manipulative experiments. As climate changes, we may also need to consider climate-smart cultivars for pollinator habitats that are adapted to regional climates and that can withstand extreme weather events to support pollinator communities.
Acknowledgments
We gratefully acknowledge the various sources of open-source data that made these assessments possible. We thank the Grozinger Lab for comments on an early draft of this manuscript. We would also like to thank the instructors and training provided through the Bayesian Models for Ecologists Short Course (NSF DEB 2042028 to Colorado State University). This research is supported by the USDA National Institute Food and Agriculture (NIFA) AFRI Pollinator Health Program (Grant #2018-67013-27538 to C M G) and the USDA NIFA AFRI Food and Agricultural Cyberinformatics Program (Grant #2021-67021-34146 to C M G). This material is based upon work supported by the National Science Foundation (NSF) Postdoctoral Research Fellowship in Biology Program under Grant No. 2109109. Any opinions, findings, and conclusions or recommendations expressed in this material are those of the authors and do not necessarily reflect the views of the National Science Foundation.
Data availability statement
No new data were created or analyzed in this study.
Conflict of interest
The authors have no conflicts of interest to declare.
Supplementary Material (1.9 MB PDF)