Guide to the Sustainability Index
- January 14, 2022
The purpose of this index is to use milk recording data to provide a picture of the sustainability of Canadian dairy herds.
Data and Calculation Principle
The data used to create this index was selected by a committee of dairy industry experts. Thus, 10 criteria were used for the calculation of the Sustainability Index. The Sustainability Index is generated three times a year, at the same time as the genetic evaluations are published, in April, August and December.
The Sustainability Index in three steps:
- A percentile rank (1-99) is assigned for each of the ten parameters of the Sustainability Index. These parameters are grouped under four themes
- For all herds on milk recording, the ten percentile ranks obtained are summed
- According to the calculated sum, the herds are finally reclassified in percentile rank
And now we have the Sustainability Index!
It is important to note that to have a Sustainability Index, the farm must have at least 7 out of 10 parameters available at milk recording. For missing data, a percentile rank of 50 is applied.
The blue line represents the percentile rank of the most current calculation, and the black bar represents that of the previous calculation. You can display the details by hovering your mouse over these elements. This is the same principle for all the graphs in the report.
On the right side of the graph, the difference between the current assessment and the last percentile assessment is displayed as a number. Green represents a positive change while red represents a negative change.
History
The history of the last two years for the Sustainability Index and for all parameters is available by selecting the History button. By hovering over the dots on the graph, you will be able to see the details of it.
Longevity and Culling
This is the percentage of cows in the herd that started at least a 3rd lactation in the last 12 months before the index is calculated.
Does having older cows change anything in the management of the herd? See how the Claude Larocque inc. farm does it.
This is the percentage of cows removed from the herd in the last 12 months for reasons classified as involuntary culling*.
The reasons for involuntary culling are:
- Reproduction
- Mammary/high cell count
- Foot and leg problems
- Injury/accident
- Disease
- Udder/teat injury
- Old age
- Difficult calving
- Pneumonia
- Milk fever
- Dropped udder
- Arthritis
- Displaced abomasum
- Staphylococcus aureus infection
- Peritonitis
- Poisoning
- Electrocution
This is the percentage of cows removed from the herd for mortality during the last 12 months prior to the calculation of the index.
Feeding and Production
This is the average percentage of cows tested individually for milk urea nitrogen (MUN) that had a result of less than 5 mg of nitrogen per dL OR more than 18 mg per dL in the last 12 months prior to the index calculation.
How to recognize these animals? Cows exceeding these thresholds are more likely to show a feed intake problem or have fertility problems.
The general principle of the Management Score is to evaluate if the genetic potential of cows to produce milk in a herd is well expressed.
Why use the Management Score in the calculation of the Sustainability Index? The objective is to isolate the “environment” portion of the popular genetic formula: Phenotype = Genetics + Environment. The environment is influenced by various factors such as housing, management, and various other practices. In other words, we can evaluate if the animal is comfortable and in good condition.
How is the herd Management Score calculated?
- A quantity of milk produced at 305 days and corrected for fat and protein is calculated for each cow in the herd and is expressed in kg of corrected milk at 305 days.
- An Estimated Breeding Value (EBV-milk) for milk is corrected for fat and protein for each registered cow in the herd and is expressed in kg of corrected milk at 305 days.
Thus, the individual Management Score for each cow = Amount of corrected milk at 305 days – EBV – Corrected Milk. - To compare the management of the herd to other Canadian herds, one must have the average value for other cows in Canada.
- This is done by calculating the average management scores for each parity group (1,2,3+) and breed (HO, JE, AY, BS).
- Then for each cow, the average of the population Management Scores for her lactation group and breed are determined. This allows us to center the values of the Management Scores of the cows around zero.
- For each herd, the average of the centered Management Scores of all cows in the herd is calculated, which gives the Management Score of the herd.
In summary, if the herd Management Score is negative, the herd is below the national average. If it is zero, it is on the Canadian average and finally, if it is positive, it is above average.
Depending on your province’s availability, the Transition Cow Index provides a quick and objective assessment of the success (or failure) of the strategy in place for cows in the transition period.
- The model first calculates the expected production for the upcoming lactation based on many factors including, among others:
- 305-day production from the previous lactation
- The lactation number
- Age of the cow
- Milking frequency
- Number of days dry
- Calving month
- The model then calculates a projected production for the lactation that is about to start, taking the production at the 1st test as a reference point.
- The Transition Cow Index = expected production – projected production
The Transition Cow Index can only be calculated for cows that are in their 2nd or later lactation since the previous lactation is used to establish the expected production.
Heifers
This is the percentage of calves reported dead within the first 24 hours after birth.
In the database, when the calf mortality value is zero, this value is excluded when less than 50% of reported calves have no associated weight.
Did you know that navel disinfection reduces calf mortality by half in herds that have adopted this practice? For more tips, check out all our publications on heifer rearing.
This is the average age at first calving of the animals that calved within the 12 months preceding the calculation of the Sustainability Index.
Health
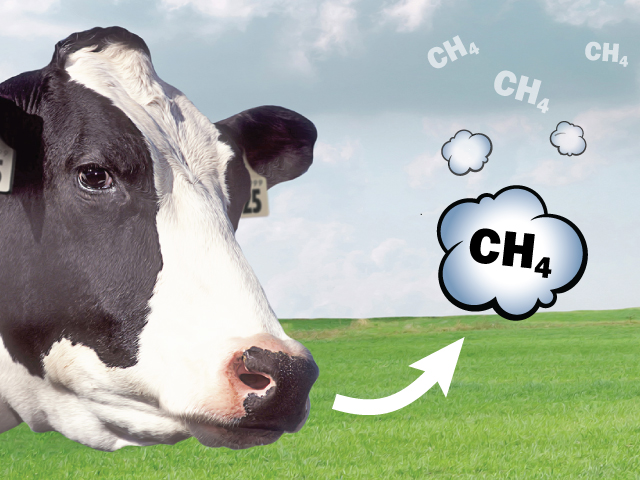
This represents the percentage of cows with a result greater than 0.20 millimoles of Beta hydroxybutyrate (BHB) per liter of milk during the 12 months preceding the calculation of the Sustainability Index.
Why was this data included in the calculation of the Sustainability Index?
The level of BHB in the blood is an indicator of the ketosis status in the herd.
The percentage of cows that had a somatic cell count (SCC) greater than 200,000 in the 12 months prior to the calculation of the Sustainability Index.
Sustainable and Profitable, it's possible!
Share

The Sustainability Index is now available in Quebec and the Atlantic provinces. It will then be available in the other provinces later this year.