A Decade of Office Construction in the 20 Fastest-Growing U.S. Cities
The last 10 years have brought about many challenges, beginning in the depths of the financial crisis and culminating with the beginning of one of the worst global health crises in a century that has affected every single part of everyday life — especially how and where we work.
Yet, data shows that cities are still growing. They’re the place to be for work, play and growing up — and the office real estate sector has thrived alongside them throughout the last decade. To that end, we wondered if and where the two trends overlapped. So, we looked at a decade of office construction data in what the latest U.S. Census Bureau reveals have been the fastest-growing U.S. cities between 2010 and 2020.
See the interactive map below for an overview of the metrics considered for each of the cities we analyzed and read on for a more detailed look into our findings on office market expansion in the 20 fastest-growing cities.
Office Development in the 20 Fastest-Growing U.S. Cities
The U.S. cities that recorded the highest population growth percentages during the last decade were a mixed bag of principal markets and suburban locations, some of which have begun to absorb growth from development in the larger urban cores nearby. Listed here by decreasing order of their population increase percentage, the cities below showed office development activity as varied as their local character, with notable construction booms in less-expected destinations than the traditional, high-density urban cores.
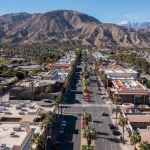
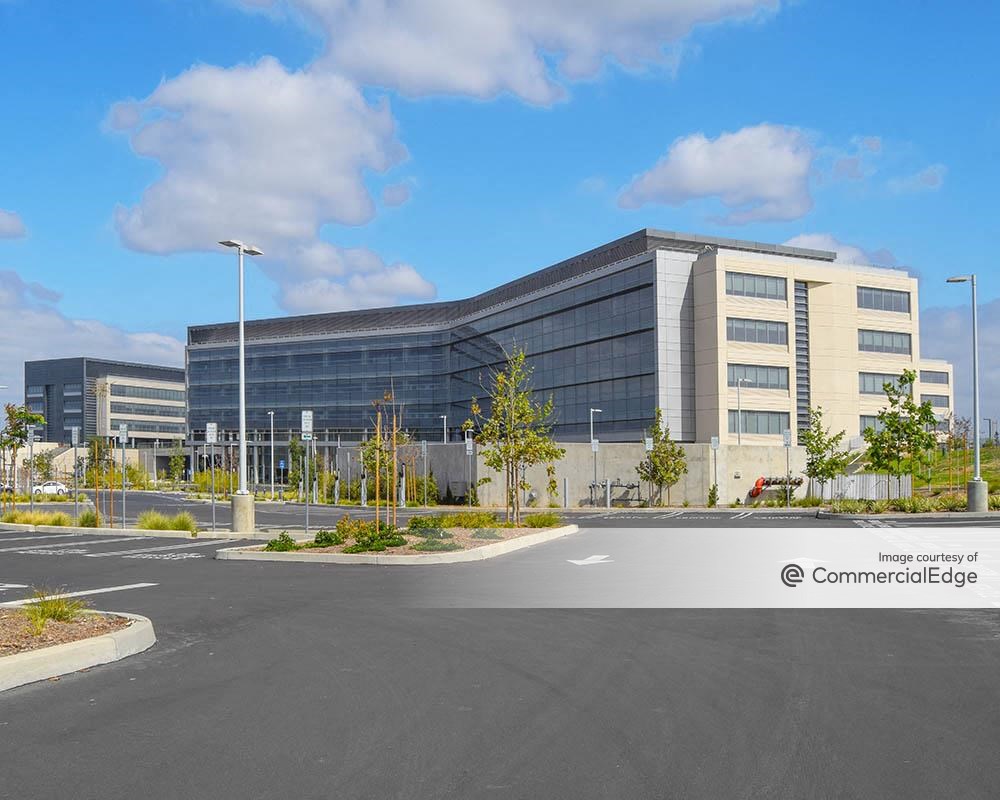
1 Irvine, Calif. – 45% population growth, 11% office market expansion
With a population increase of 45% from 2010 through 2020, Irvine took the top spot among the fastest-growing cities in the U.S. However, the local office market came in 28th in terms of new office space completed during the same timeframe. Specifically, roughly 4.22 million square feet of new Irvine office space was brought to market between 2010 and 2020, representing an 11% market expansion compared to the total figures recorded at the start of 2010. At the close of the decade, existing inventory encompassed 43,631,119 square feet of office space across 739 buildings that are at least 25,000 square feet in size — making Irvine the 24th-largest office market among the cities considered for this report.
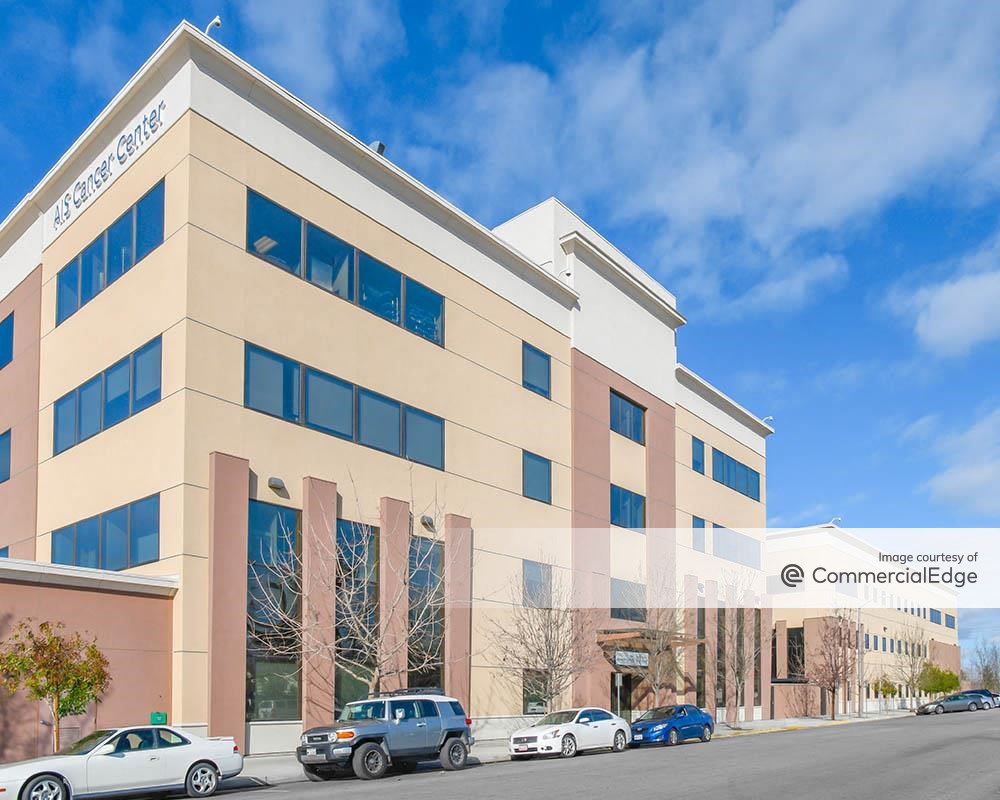
Perhaps the most noteworthy local property of the decade was the 1-million-square-foot office campus developed on the 73-acre site of the shuttered El Toro military base: Five Point Gateway has changed hands several times since Irvine chipmaker Broadcom acquired the land in 2014 — most recently in 2020, when two of the four campus buildings sold for $355 million. Located at 15101 and 15191 Alton Parkway, the buildings are still home to Broadcom’s local operations and their sale to PRP marked the largest Irvine office sale of 2020. Earlier that same year, original property owner Five Point also disposed of a third Gateway property: The 190,000-square-foot office building at 15161 Alton Parkway was acquired for $108 million by City of Hope, which plans to create a $1 billion cancer treatment and research facility.
2 Orlando, Fla. – 29% population growth, 7% office market expansion
The population of Orlando increased 29% during our decade of focus, placing the city second among the country’s fastest-growing urban centers. During that same period, developers delivered 32 buildings, incorporating 2,318,088 square feet of new space to the local office market. This marked a 7% increase compared to the 31.3-million-square-foot market size tracked at the start of 2010 and, as a result, ranked Orlando 41st by total square footage built. It also brought total inventory up to 33,651,460 square feet — the 36th-largest urban office market on our list at the close of 2020.
Admittedly, these numbers pale in comparison to office development in the country’s largest markets, but they do speak to the growing investment appeal of smaller U.S. cities in recent years. In fact, a 2019 CommercialCafe analysis of office construction in Florida cities smaller than 300,000 residents found that Orlando was, by far, the favorite for office development in the Sunshine state.
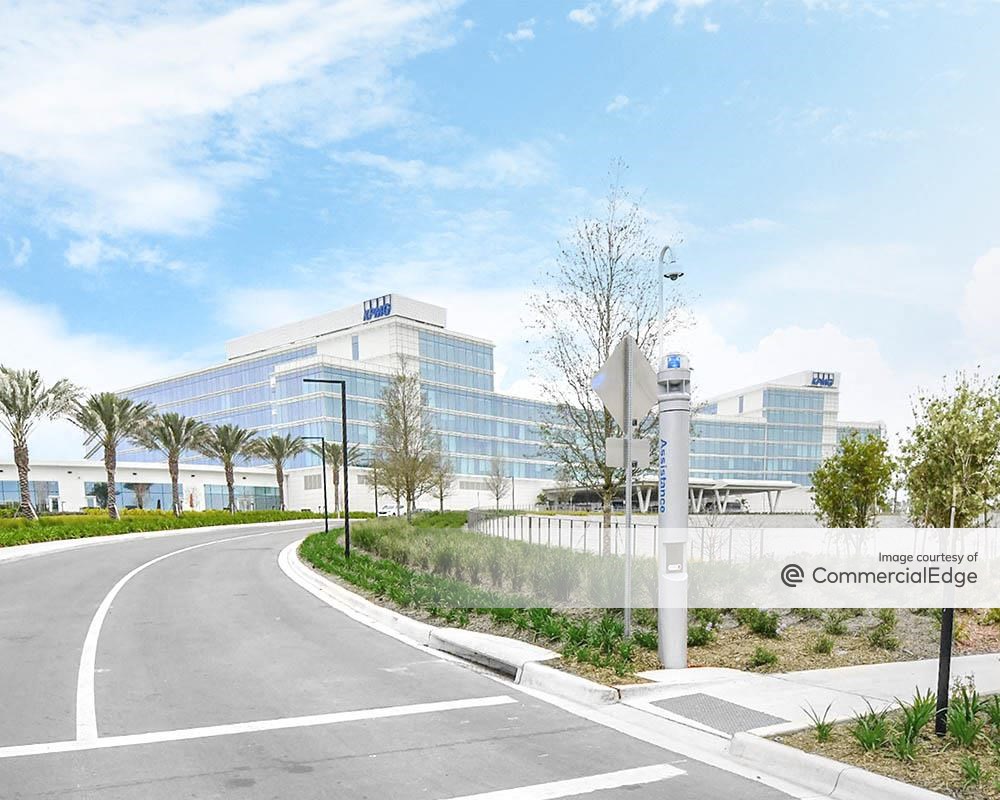
Meanwhile, the largest single office project to be completed here between 2010 and 2020 was the KPMG Lakehouse. Located in the Lake Nona neighborhood, the massive, 780,000-square-foot property opened in 2020 and incorporates 350,000 square feet of premium Orlando office space. The property is dedicated to the learning, development, and innovation center that KPMG designed to ensure its ability to attract and retain top talent, as well as tackle the challenges of an increasingly dynamic marketplace and support innovation throughout the firm.
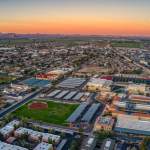
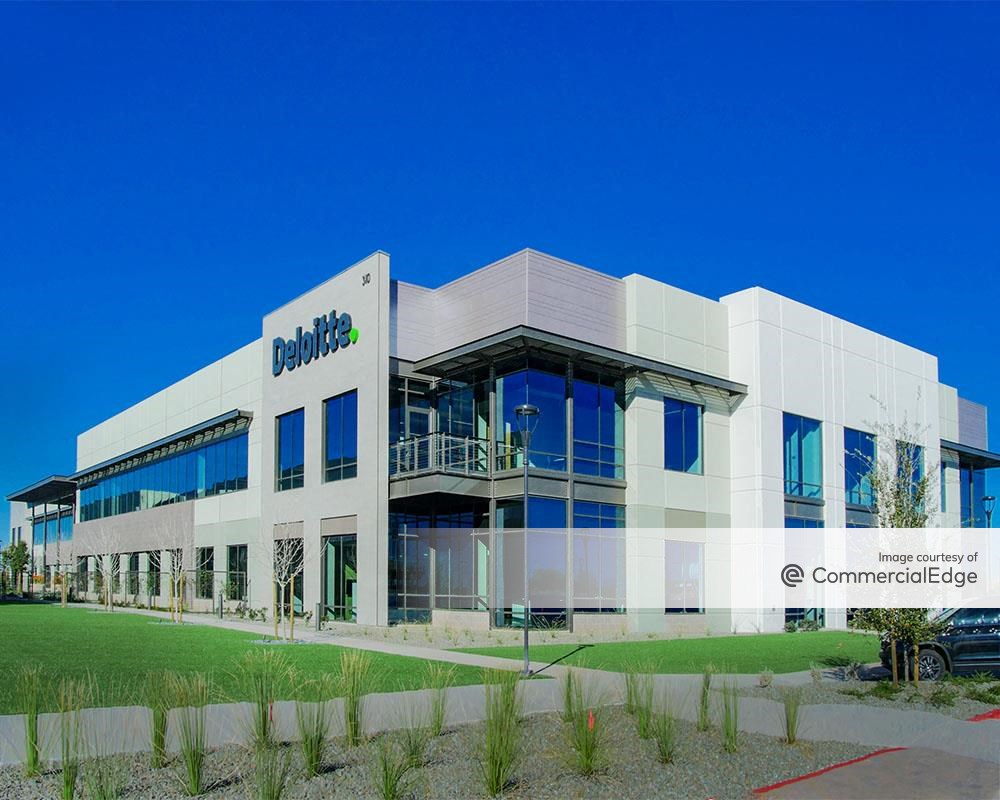
3 Gilbert, Ariz. – 29% population growth, 49% office market expansion
Between 2010 and 2020, the population of Gilbert increased 29%, ranking it third among the fastest-growing cities in the U.S. But Gilbert took the top spot in terms of office market expansion of the cities on our list: The total number of square feet delivered here during the last decade marked a 49% increase from its January 2010 totals. More precisely, at the close of 2020, existing inventory in Gilbert encompassed nearly 4.8 million square feet of office space, compared to the 3.2 million total at the start of 2010.
What’s more, this most recent growth spurt is just the latest in the city’s strategic transformation from a small, East Valley town to a corporate headquarters destination. Vision-driven local administration investment into infrastructure, public safety, and quality-of-life amenities paved the way for the Rivulon business district — an exceptional, 250-acre, mixed-use development that has become home to international corporate tenants, including: Isagenix International, the largest employer in the area; Deloitte, which occupies half of The Commons at Rivulon office development; Morgan Stanley, which expanded on its previously leased office space in Gilbert in December of last year; Merrill Lynch; and Amerifirst Financial.
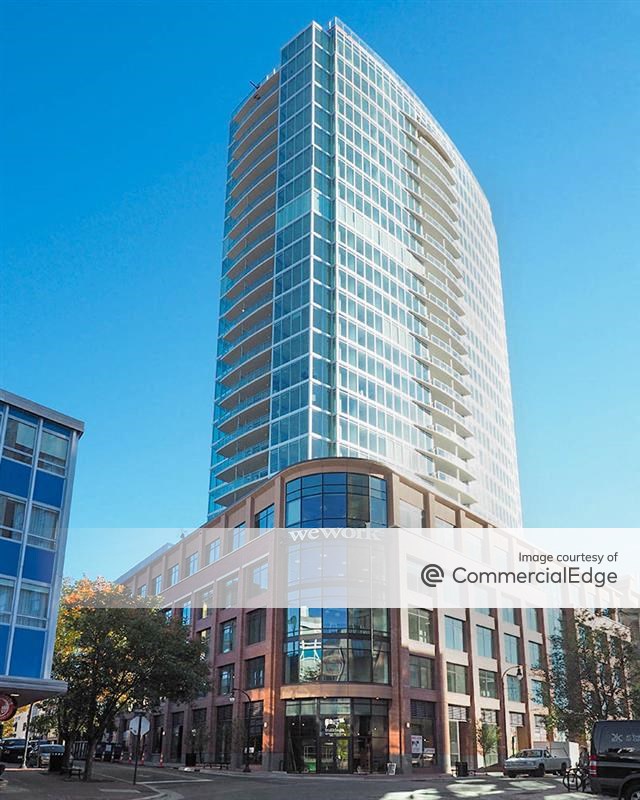
4 Durham, N.C. – 24% population growth, 18% office market expansion
North Carolina’s Research Triangle experienced notable growth throughout the past decade. In particular, the city of Durham recorded the fourth-highest percentage population increase from 2010 through 2020: The number of residents grew 24% between the two most recent Census counts. Even so, in terms of office space added during that same timeframe, Durham’s pipeline yield ranked 36th among the cities considered for this analysis. Specifically, developers here completed 3,063,671 square feet of new office space across 27 buildings. This brought the local inventory to a little more than 20 million square feet — an 18% market expansion compared to the 17 million total at the start of 2010.
The largest office completion of the decade was the 1948 cigarette factory-to-office conversion at 701 W. Main St.: The Chesterfield Building redevelopment was completed in 2017 and incorporates roughly 275,000 square feet of LEED Gold-certified Durham office space that accommodates a Duke University-led research hub, as well as coworking and shared wet lab space for life science startups (operated by BioLabs NC).
However, the most prominent local development of the decade was One City Center, which was completed in 2018. The 27-story, 424,000-square-foot, mixed-use property includes nearly 131,000 square feet of office space, in addition to premium-location retail and 139 residential apartments and condominiums.
5 Fort Worth, Texas – 24% population growth, 19% office market expansion
The western-most component of the Dallas-Fort Worth metroplex recorded the fifth-largest population growth from 2010 to 2020: Here, the number of residents increased 24% to a total of nearly 919,000, according to the most recent Census. More precisely, at the close of 2020, the local office inventory encompassed roughly 31,850,000 square feet of office space in buildings that are at least 25,000 square feet in size. Furthermore, construction data tracked by CommercialEdge shows that 5,038,996 square feet of that total was completed since the start of 2010, marking a 19% office market expansion during the last decade.
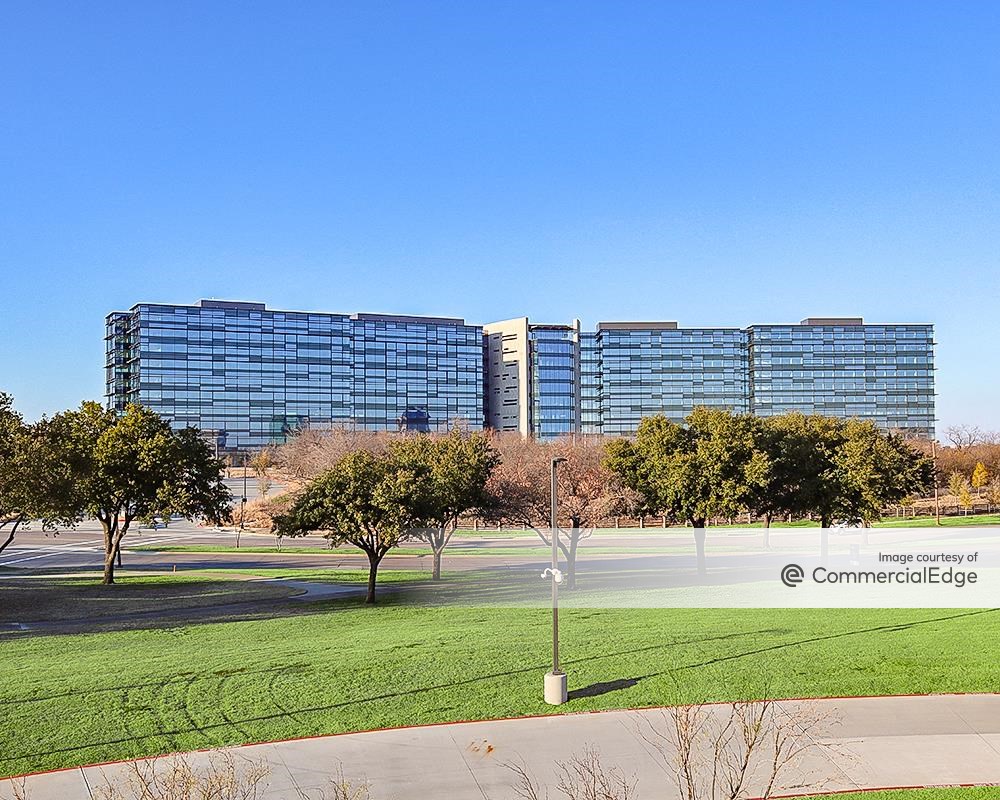
Notably, one major local project accounted for about 36% of the total office pipeline yield during the 10 years considered: The American Airlines headquarters campus completed in 2019 on Skyview Drive (and named after former company President & Chairman Robert Lloyd Crandall) incorporates 1.8 million square feet of LEED Gold-certified Fort Worth office space across multiple buildings. The 124-acre, car-free campus includes 8.3 miles of bike trails; a cafeteria with celebrity-chef programming; a volleyball court; and a swimming pool.
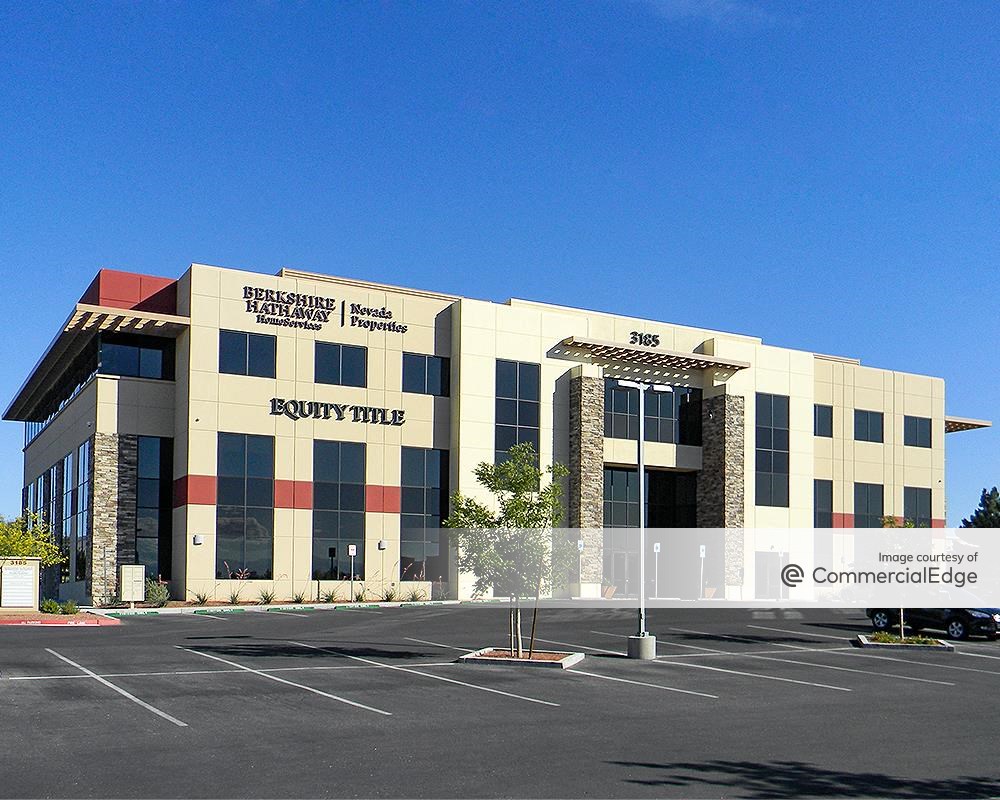
6 Henderson, Nev. – 23% population growth, 8% office market expansion
The southeast Las Vegas Valley municipality of Henderson grew by almost 60,000 people — more than 23% — between 2010 and 2020, which ranked it as the sixth-fastest-growing city in the country. Located just 16 miles southeast of downtown Las Vegas, the city’s master-planned communities were attractive to new residents looking for affordable homes close to business hubs, as well as quality-of-life amenities, such as high-rated schools and parks, according to local officials.
And while the office market also expanded during the same decade of reference, it did so at a more moderate pace: During the 10 years considered, developers here completed roughly 417,000 square feet of new office space, an increase of 8% from the inventory total of 4.9 million square feet recorded at the start of 2010.
The largest office project completed in Henderson between 2010 and 2020 was the four-building Seven Hills Plaza business park located on St. Rose Parkway. Developed in three phases in 2012, 2014, and 2018, the complex encompasses nearly 160,000 square feet of class A suburban Las Vegas office space. The occupant roster includes well-known, multinational conglomerate holding company Berkshire Hathaway, as well as several medical office tenants and financial services and law firms.
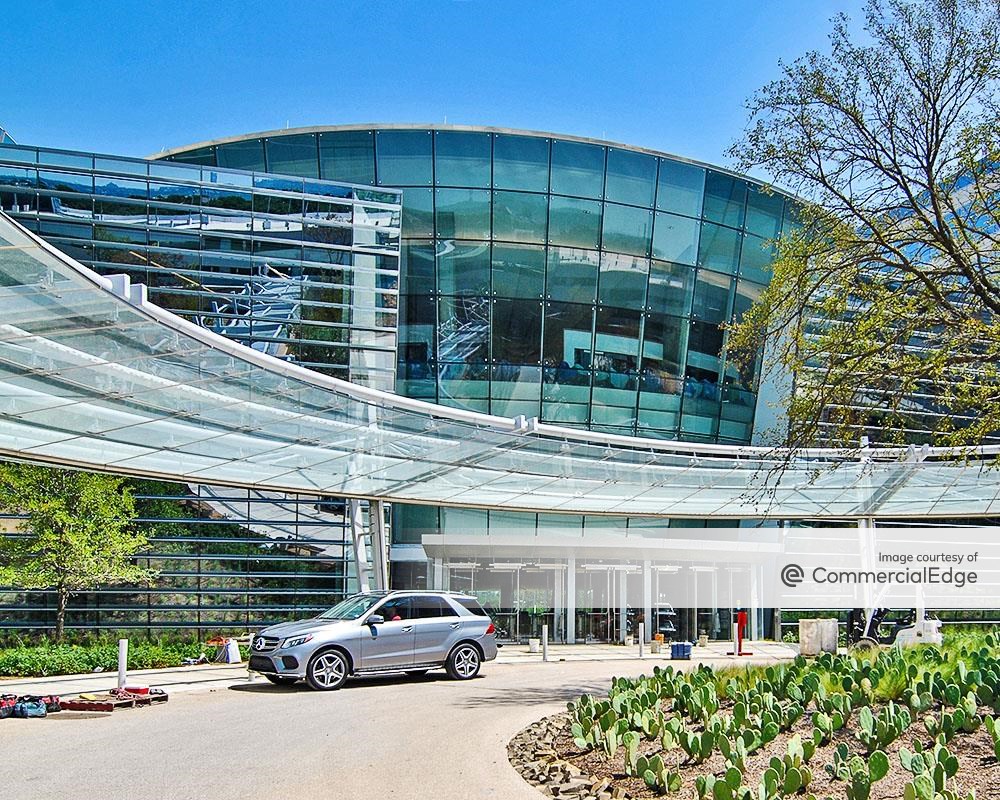
7 Austin, Texas – 22% population growth, 28% office market expansion
At nearly 962,000 residents (per the latest Census count), Austin is the largest of the 20 cities highlighted in this report. During the last decade, it recorded a population growth of 22%, which ranked it as the seventh-fastest-growing city in the country. Likewise, the local office market also underwent a significant expansion to reach a total of 76,554,796 square feet of existing office space at the close of 2020 — the 11th-largest office market of the cities considered for this analysis. Moreover, new local developments since the start of 2010 marked the fifth-largest pipeline yield, both by office square footage added (nearly 17 million), as well as percentage increase throughout the decade (28%).
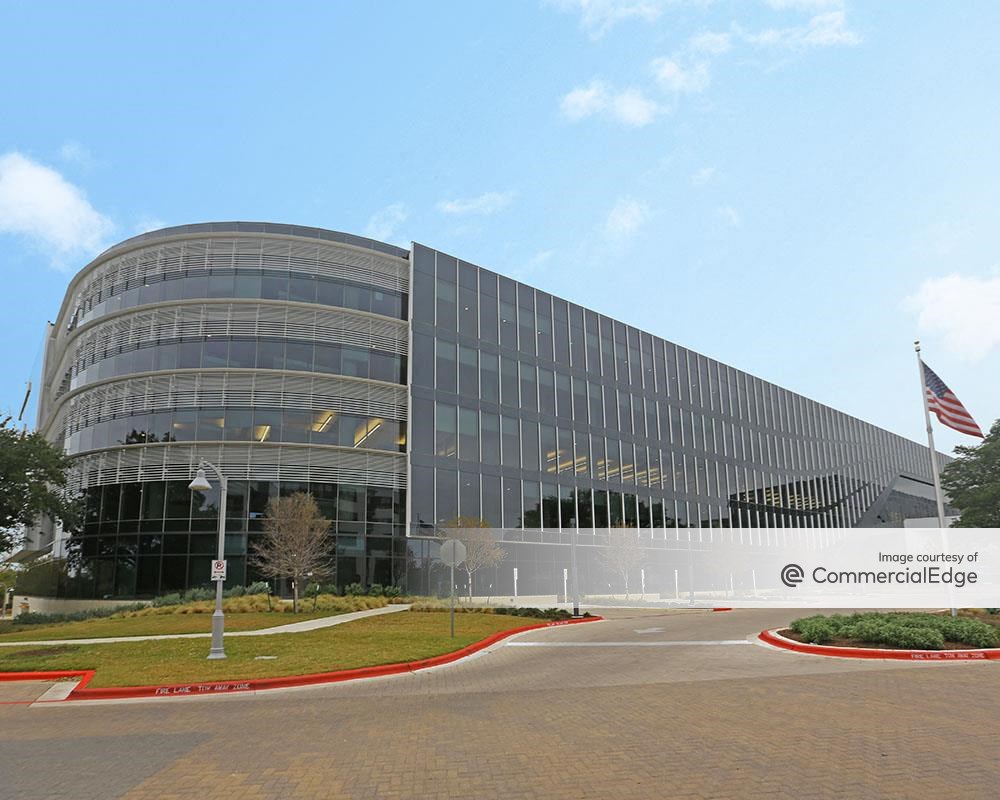
Here, the largest single local office project completed between 2010 and 2020 was the Oracle headquarters, dubbed Waterfront Campus. The two-building property incorporates 980,000 square feet of Austin office space and was delivered in 2018 (Phase I) and 2020 (Phase II). The 25-acre corporate campus was the first major office development on the Southeast Waterfront and helped transform the area into a mixed-use urban core.
8 Seattle – 21% population growth, 31% office market expansion
Seattle, the largest urban center in the Pacific Northwest, gained 21% more residents since 2010 — the eighth-largest population increase recorded between the two most recent Census counts. The amount of square footage added to this market during that time was the third-largest office pipeline yield among the cities we analyzed. Specifically, developers here completed 18,609,321 square feet of new Seattle office space across a total of 85 buildings. At the close of 2020, the Seattle office market had grown 31% in terms of space added and totaled 78,485,054 square feet of inventory to make it the 10th-largest office market on our list.
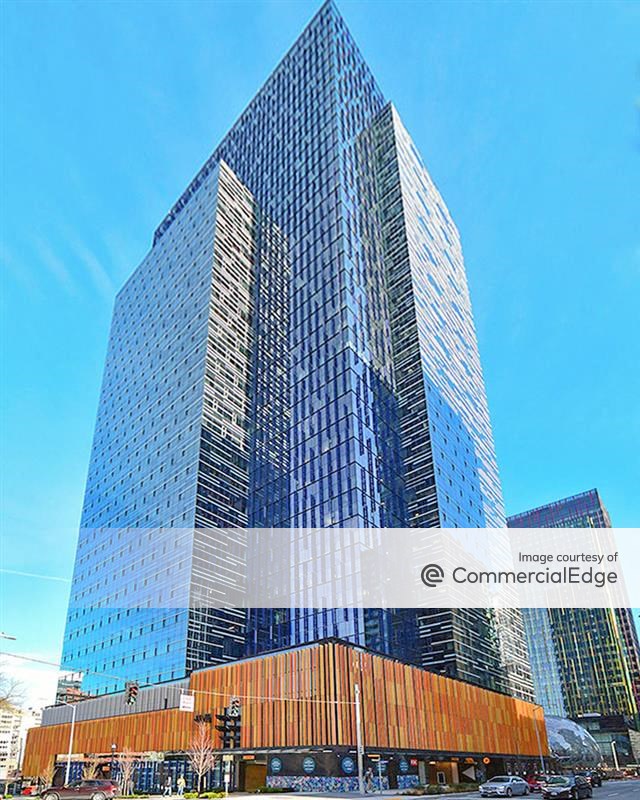
The largest office project completed here since 2010 has transformed a neighborhood and left a lasting mark on the Seattle skyline: Amazon’s three-block redevelopment of Denny Triangle is three office towers that span more than 35 floors each and amount to a combined 3.3 million square feet of trophy office space, located just north of downtown Seattle. Named after Rufus, a Welsh corgi that was a fixture at the company from its earliest days until 2009, Rufus 2.0 was completed in two phases: Block 14 and Block 19 were delivered in 2016, while Block 20 opened in 2019.
9 Charlotte, N.C. – 20% population growth, 15% office market expansion
With a population increase of 20% from 2010 through 2020, Charlotte landed ninth among the fastest-growing cities in the U.S. Similarly, the local office market came in 12th in terms of new office space completed during that same timeframe. Specifically, 8,456,383 square feet of new Charlotte office space was brought to market between 2010 and 2020, representing a 15% increase from the start of 2010. By the end of the decade, existing inventory encompassed 66,492,711 square feet of office space across 828 buildings, making Charlotte the 14th-largest office market among the cities considered for this report.
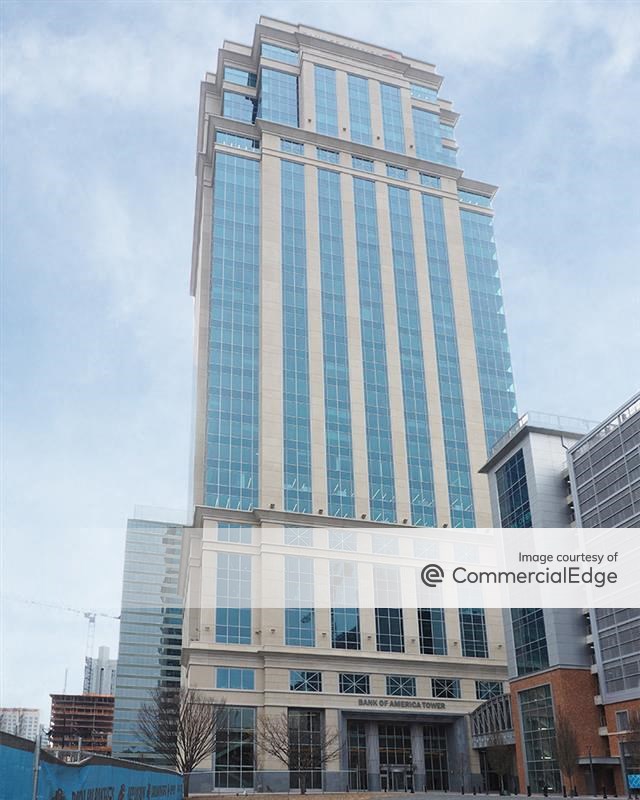
The most sizeable office project completed here during the decade of reference was the Bank of America Tower at 620 South Tryon St. Completed in 2019, the 33-story high-rise incorporates more than 840,000 square feet of class A Center City Charlotte office space. It's located just a few blocks from the bank’s 60-story Corporate Center, which was built in 1990.
10 Denver – 19% population growth, 15% office market expansion
The population of Denver increased 19% during our decade of focus, placing the city 10th among the country’s fastest-growing urban centers. During that period, developers delivered 75 buildings to incorporate 8,058,617 square feet of new Denver office space, which marked a 15% increase from the market's size at the beginning of 2010. This ranked Denver 13th by total square footage built, and brought total inventory up to 61,810,782 square feet — the 16th-largest urban office market on our list at the close of 2020.
Notably, consistent growth throughout the decade both in the city and the surrounding metropolitan area is a strong indication that the comprehensive zoning code update adopted in 2010 (which sought to implement a sustainable and future-oriented development guide) continues to bear its intended fruit.
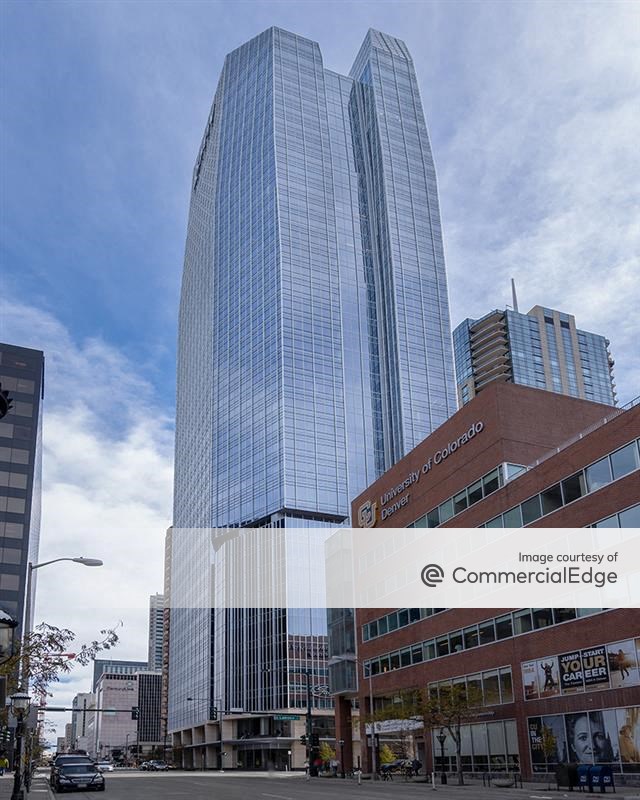
Denver’s largest office completion of the decade was the 671,101-square-foot office tower at 1144 15th St., which opened in 2018. The first trophy-class office tower to be built in Denver in more than 30 years, 1144 15th was designed by Pickard Chilton and features 10-foot, floor-to-ceiling windows that make good use of the location’s unobstructed views of the mountains and city.
11 Omaha, Neb. – 19% population growth, 13% office market expansion
Between 2010 and 2020, the population of Omaha increased 19% to rank 11th among the fastest-growing cities in the U.S. Even so, Omaha took the 22nd spot in terms of office market expansion among the cities on our list as it recorded a 13% increase in office property delivered here during the same decade. At the close of 2020, existing inventory encompassed nearly 28.5 million square feet of office space, compared to the 25 million total at the start of 2010.
The largest office delivery in Omaha was the TD Ameritrade headquarters building at 200 S. 108th Ave., which was completed in 2013. Designed by HOK architects, the 12-story building incorporates 530,000 square feet of class A Omaha office space and is one the largest LEED Platinum-certified properties in the state. Integrated sustainable design features include a green roof; solar thermal panel installations and wind turbines; an innovative rain-screen façade; gray water and enclosure systems; and eco-friendly flooring material. Developers also included recycled and rapidly renewable building materials during construction.

12 Aurora, Colo. – 19% population growth, 4% office market expansion
The greater Denver metro area experienced notable growth during the past decade. In particular, the nearby city of Aurora recorded the 12th-highest percentage population increase from 2010 through 2020: The number of residents grew 19% between the two most recent Census counts. But, in terms of office space added during that same timeframe, the pipeline yield in Aurora ranked 85th among the cities considered for this analysis. Specifically, developers here completed 407,700 square feet of new office space across four buildings. This brought the local inventory to a little more than 9,563,000 square feet — a 4% market expansion compared to the 9.2 million total at the start of 2010.
Granted, the greater Denver office market is still in its most recent expansion phase and there’s still room to sprawl across the metropolitan area. As such, comparatively low figures for the suburban submarket of Aurora are understandable. However, they’re also no reason to dismiss the local growth potential. Rather, the numbers are a sign that construction activity here between 2010 and 2020 was just the beginning. In fact, plans have already been announced for a new, $3.1 billion property in the E-470 corridor that’s expected to break ground this year and include more than 2.2 million square feet of industrial, office and retail space, as well as 5,000 residential units; more than 700 hotel rooms; and 53 acres of parks and open space.
Meanwhile, the largest local project completed between 2010 and 2020 was the Fitzsimons 100 building — Phase I of the Fitzsimons Village development. Developed by the Corporex Colorado, Fitzsimons Village was the first new mixed-use project in the successful Anschutz Medical Campus in Aurora. Phase I was completed in 2011 and delivered a 151,700-square-foot office building that was subsequently purchased by Children’s Hospital Colorado for nearly $51 million.

13 Atlanta – 19% population growth, 8% office market expansion
The state capital of Georgia recorded the 13th-largest population growth from 2010 to 2020. In that time, the number of residents here increased 19% to a total of nearly 500,000, according to the most recent Census. At the close of 2020, the local office inventory encompassed 122,966,568 square feet of office space, which ranked Atlanta as the fifth-largest office market in the country. 9,531,728 square feet of that total was completed since the start of 2010, marking a modest 8% office market expansion during the decade of reference.
Incorporating 720,000 square feet of premium Atlanta office space, Coda at Tech Square was the largest local office project delivered during the 10 years considered. Completed in 2019, the property was designed to integrate business innovation and institutional research, bringing together office space, research labs, and data center facilities for the benefit of its carefully curated tenant roster, which includes names such as Georgia Tech University, WeWork and Cisco.

14 Irving, Texas – 19% population growth, 16% office market expansion
With a population increase of 19% from 2010 through 2020, Irving landed 14th among the fastest-growing cities in the U.S., although the local office market came in 23rd in terms of new office space completed during the same time. Specifically, 5,266,134 square feet of new Irving office space was brought to market between 2010 and 2020, representing a 16% increase over the start of 2010. At the close of the decade, existing inventory encompassed 37,952,914 square feet of office space across 335 buildings, making Irving the 31st-largest office market among the cities considered for this report.
Here, the largest office completion in the market since 2010 was the Pioneer Natural Resources Headquarters building at 777 Hidden Ridge Drive. Completed in 2019, the massive, 1,125,000-square-foot property is part of the local $1 billion Hidden Ridge mixed-use development that is also home to a similarly sized campus occupied by Verizon.
15 Jersey City, N.J. – 18% population growth, 1% office market expansion
Between 2010 and 2020, the number of Jersey City residents increased 18%. While this placed the city 15th in terms of population growth, the local office market expansion was actually the smallest recorded among the 20 cities highlighted in this report. During that same timeframe, developers delivered 112,021 square feet of new office space, which represented an increase of 1% compared to total figures at the start of 2010. This ranked Jersey City 95th by total square footage built and brought total inventory up to 16,453,883 square feet to make it the 58th-largest urban office market on our list at the close of 2020.
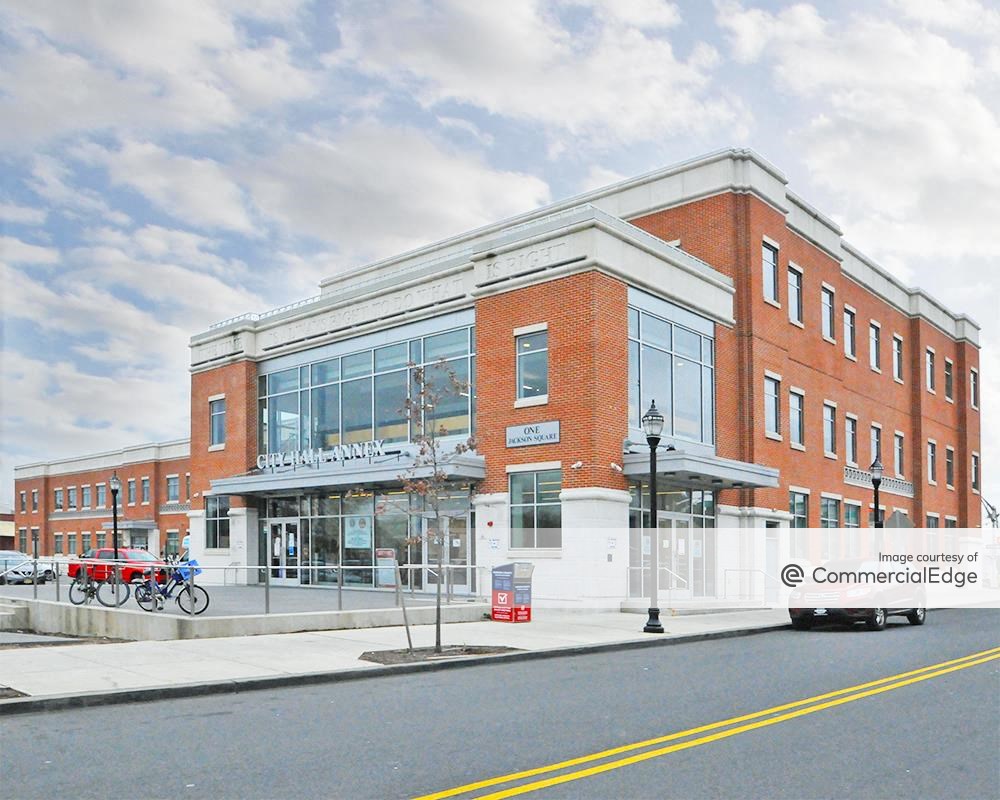
The largest office building completed here was 1 Jackson Square. Finished in 2018, the 45,000-square-foot office building is part of a multi-phase redevelopment intended for use by the Jersey City administration that aims to revitalize and anchor the neighborhood. Three of the four planned Jackson Square buildings are already complete and home to the Jersey City Department of Housing, Economic Development and Commerce (HEDC); Planning, Zoning & Construction Department; and Health & Human Services. The fourth — an 11-story office building — is scheduled for completion in 2023. It will serve as the headquarters for all Public Safety service departments and bring the total project size total to 358,000 square feet.
16 Oklahoma City, Okla. – 17% population growth, 22% office market expansion
Oklahoma City grew by more than 101,000 people — roughly 17% — between 2010 and 2020, which ranked it as the 16th-fastest-growing city in the country. Developers here completed roughly 5,541,879 square feet of new office space across 41 properties that are 25,000 square feet or larger in that time, an increase of 22% from the inventory total of 24,728,718 square feet recorded at the start of 2010. At the close of 2020, OKC was the 41st-largest office market, following the sixth-largest market expansion among the cities surveyed for this report.
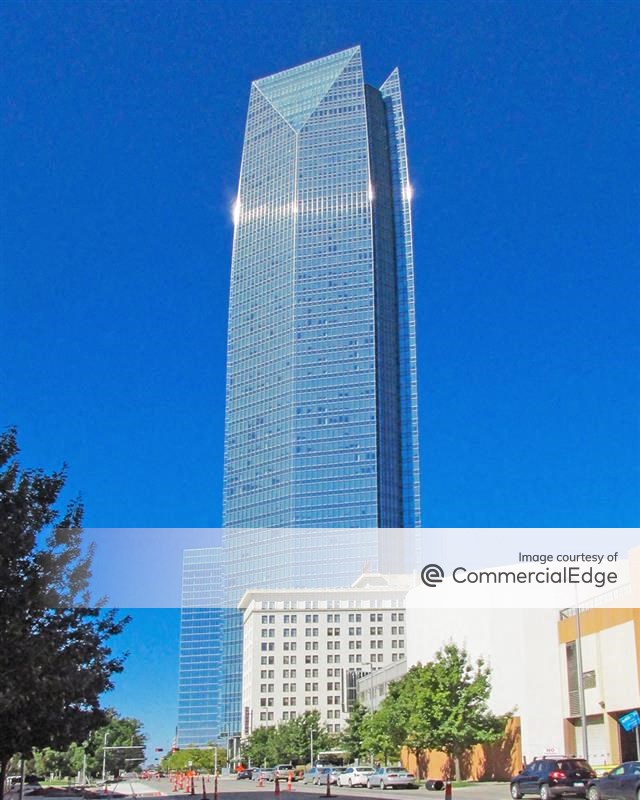
The largest office project of the decade in OKC was completed in 2011: Located at 333 W. Sheridan Ave., the Devon Energy Center also ranked among the 20 largest office developments since 2010 nationwide. The 52-story skyscraper incorporates roughly 1,542,000 square feet of trophy class Oklahoma City office space and is LEED Gold-certified.
17 Reno, Nev. – 17% population growth, 2% office market expansion
The second Nevada city to rank among the top 20 fastest-growing U.S. cities, Reno saw its number of residents increase 17% between 2010 and 2020, which also placed it 17th for percentage of population growth. Meanwhile, the local office market grew at a far more modest pace: Specifically, developers here delivered 128,226 square feet of new office space, which represented an increase of just 2% compared to total figures at the close of 2010. This ranked Reno 94th by total square footage built and brought its total inventory up to 7,708,505 square feet, which made it the 84th-largest urban office market on our list at the close of 2020.
Here, the largest local office development added 50,000 square feet of Reno office space across two buildings on a sprawling, 12-acre property: The Village at Rancharrah was completed in 2020 at 7700 Rancharrah Parkway and brought premium dining, shopping and office space opportunities to the south Reno area.
View this post on Instagram
18 Chandler, Ariz. – 17% population growth, 44% office market expansion
The second major Phoenix suburban submarket to rank among the country’s 20 fastest-growing cities was Chandler. The number of residents here increased 17% between the two most recent Census counts, which placed it 18th by percentage of population growth. In the mean time, the local office market recorded the second-largest pipeline yield by percentage increase throughout the decade, second only to Gilbert (49%) among the cities considered for this report. To be precise, 3,099,937 square feet of new Chandler office space was delivered between 2010 and 2020, representing a market expansion of 44% compared to totals recorded at the start of 2010. This was certainly a welcome boost, as existing inventory at the close of the decade encompassed 10,124,375 square feet of office space across 288 buildings, which took Chandler to the 74th-largest office market among the cities we surveyed.
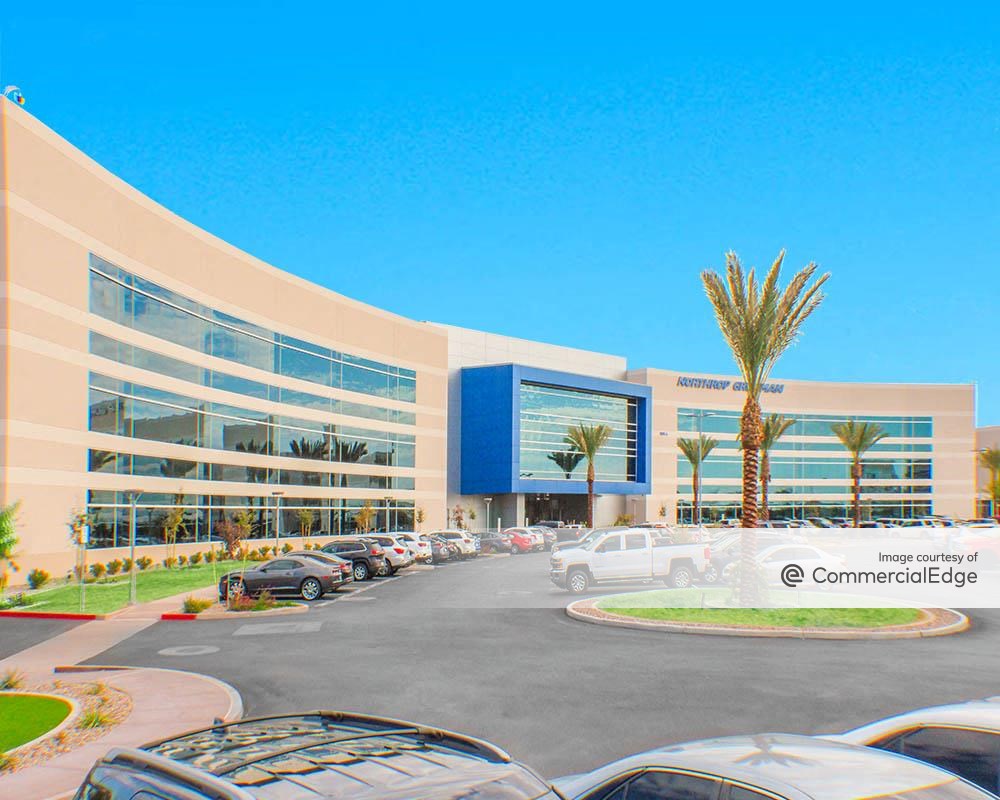
The largest single-building office completion in Chandler was part of the Allred Park Place complex. Building 17 delivered 355,734 square feet of class A office space across three floors. Completed in 2019, it's part of a 633,000-square-foot, build-to-suit campus for aerospace and defense company Northrop Grumman. The property was designed to host the company’s launch vehicle design, development, manufacturing and testing divisions.
19 Bakersfield, Calif. – 16% population growth, 8% office market expansion
The San Joaquin Valley city of Bakersfield grew by almost 56,000 people — or 16% — between 2010 and 2020, which made it the 19th-fastest-growing city in the country. And although the office market also expanded during the same decade, it did so at a slower pace: During the 10 years considered, developers here completed roughly 544,106 square feet of new office space in properties, marking an increase of roughly 8% from the inventory total of nearly 6.7 million square feet recorded at the start of 2010.
In 2013, the city welcomed what would be the largest office project of the decade — a two-building property located at 2620 and 2700 Chester Ave. It includes nearly 119,000 square feet of LEED Silver-certified downtown Bakersfield office space across both buildings and is occupied by premium medical office tenants.
20 Raleigh, N.C. – 16% population growth, 18% office market expansion
At nearly 468,000 residents per the latest Census count, Raleigh is the larger component of the North Carolina Research Triangle region. The city rounds out our list of the 20 fastest-growing cities in the U.S. with an increase of 16% in its number of residents between 2010 and 2020.
Notably, the local office market came in 26th in terms of new office space completed during that same timeframe. Here, 4,329,285 square feet of new Raleigh office space was brought to market between 2010 and 2020, representing an increase of 18% from the 24,037,068 square feet recorded at the start of 2010. At the close of the decade, existing inventory incorporated 28,366,353 square feet of office space across 505 buildings, making Raleigh the 44th-largest office market among the cities considered for this report.
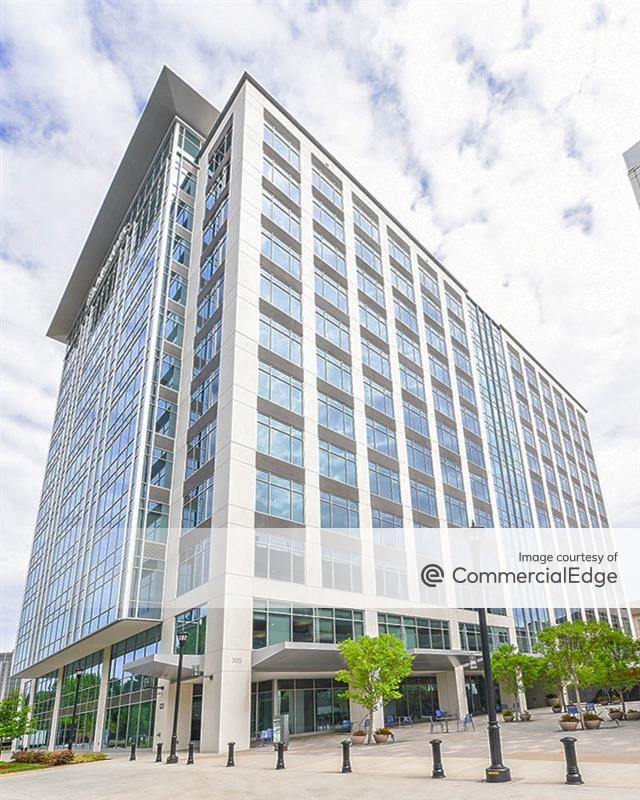
Located at 305 Church at North Hills St., Midtown Plaza was the largest office project brought to market in Raleigh between 2010 and 2020. Completed in 2017, the building encompasses more than 329,000 square feet of class A office space across 12 stories and has since attracted tenants such as biopharmaceutical company Gilead Sciences, which moved into three floors of the building late last year.
Methodology
Data for this report is per CommercialEdge and includes all properties with the primary use type of office. Properties selected had at least 25,000 square feet and were completed between January 1, 2010, and December 31, 2020.
U.S. cities included here all recorded population growth during the last decade and had at least 1 million square feet of office space in total.
Property images courtesy of CommercialEdge.