
Degradation of Polyvinyl Alcohol in US Wastewater Treatment Plants and Subsequent Nationwide Emission Estimate


Abstract
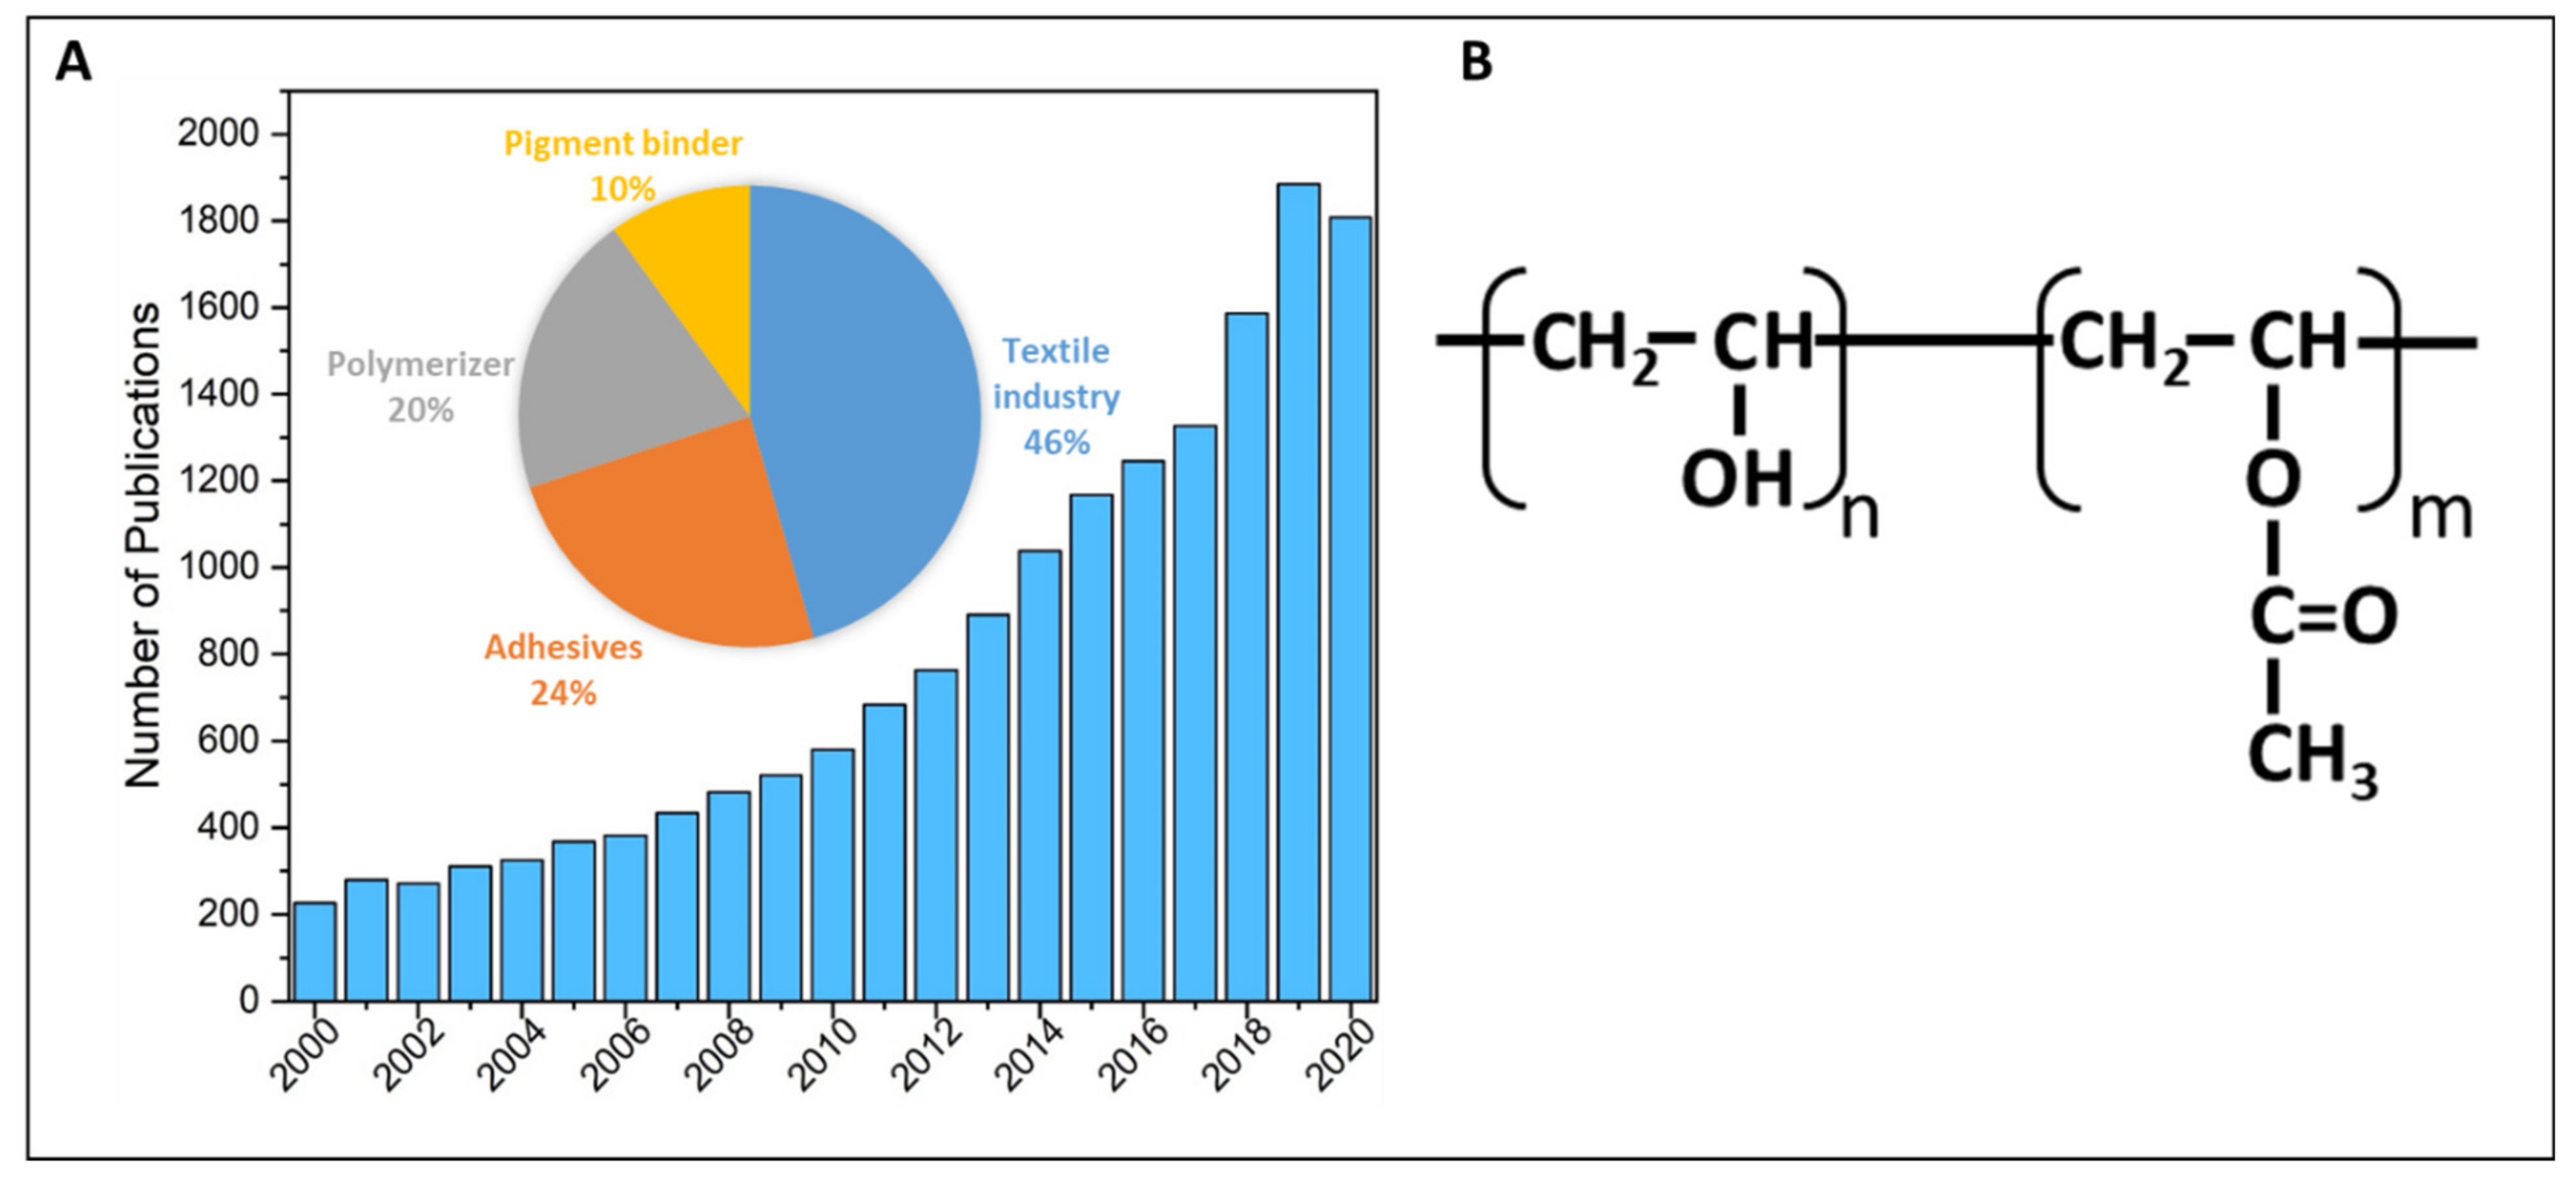
:1. Introduction
2. Materials and Methods
2.1. Online Survey
2.2. Water Use and Wastewater Generation in the US
2.3. LDP Usage and Treatment
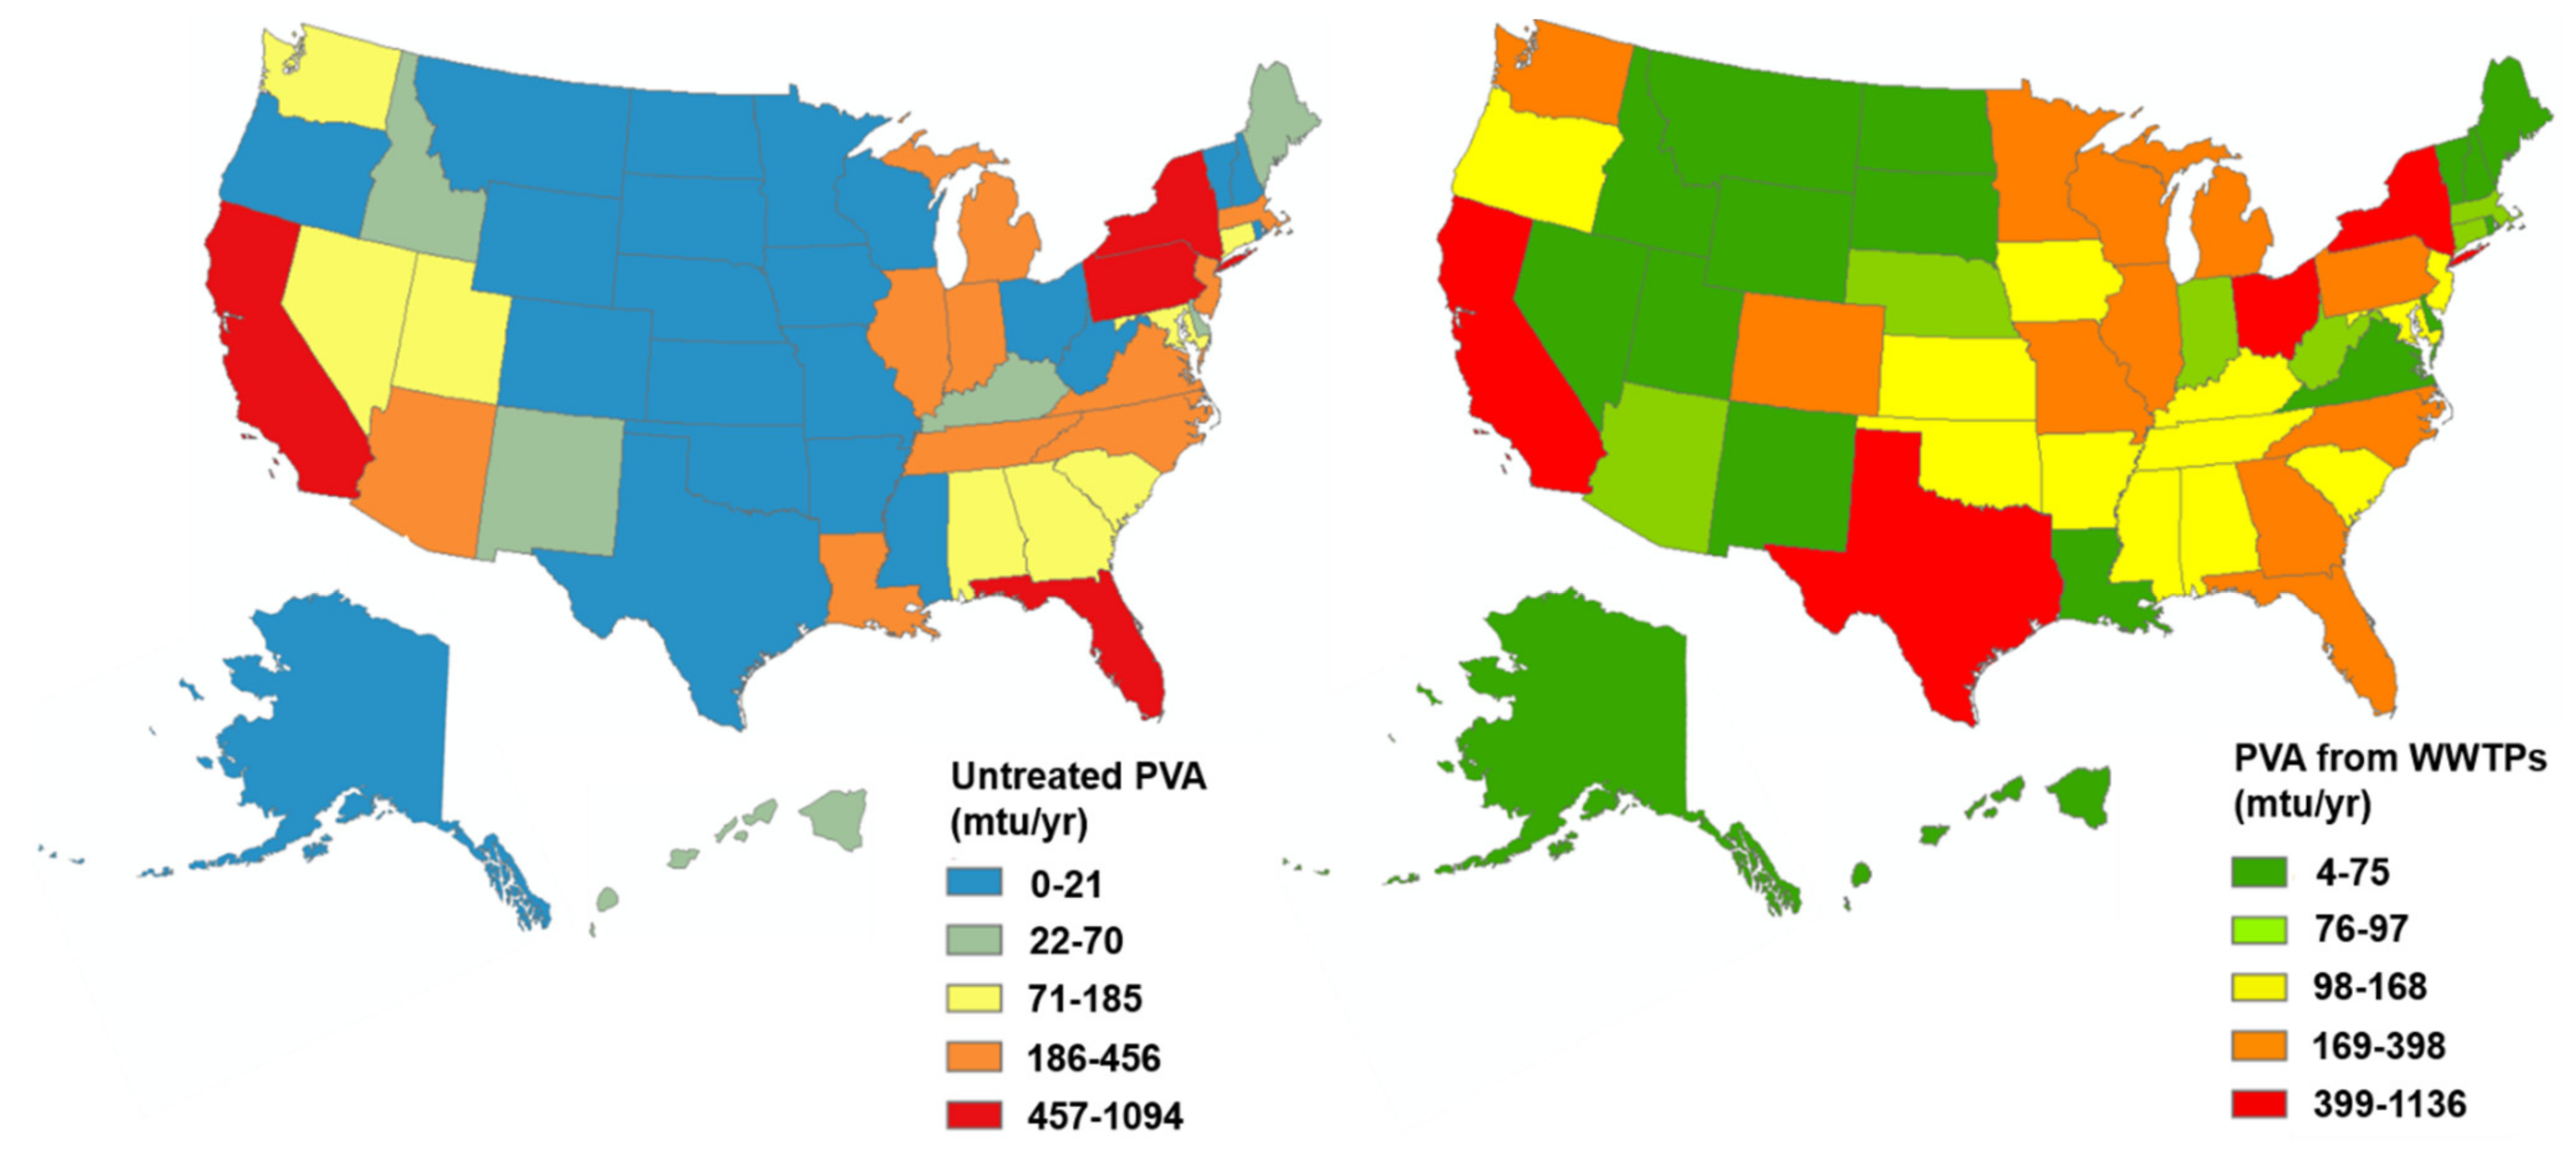
2.4. GIS and Mapping
2.5. Literature Review
3. Removal of PVA in WWTPs
3.1. Primary Treatment
3.2. Secondary Treatment
3.2.1. Activated Sludge Process (ASP)
3.2.2. Secondary Clarifier
3.3. Tertiary Treatment
3.4. Disinfection
3.5. Filtration
3.6. Anaerobic Digestors
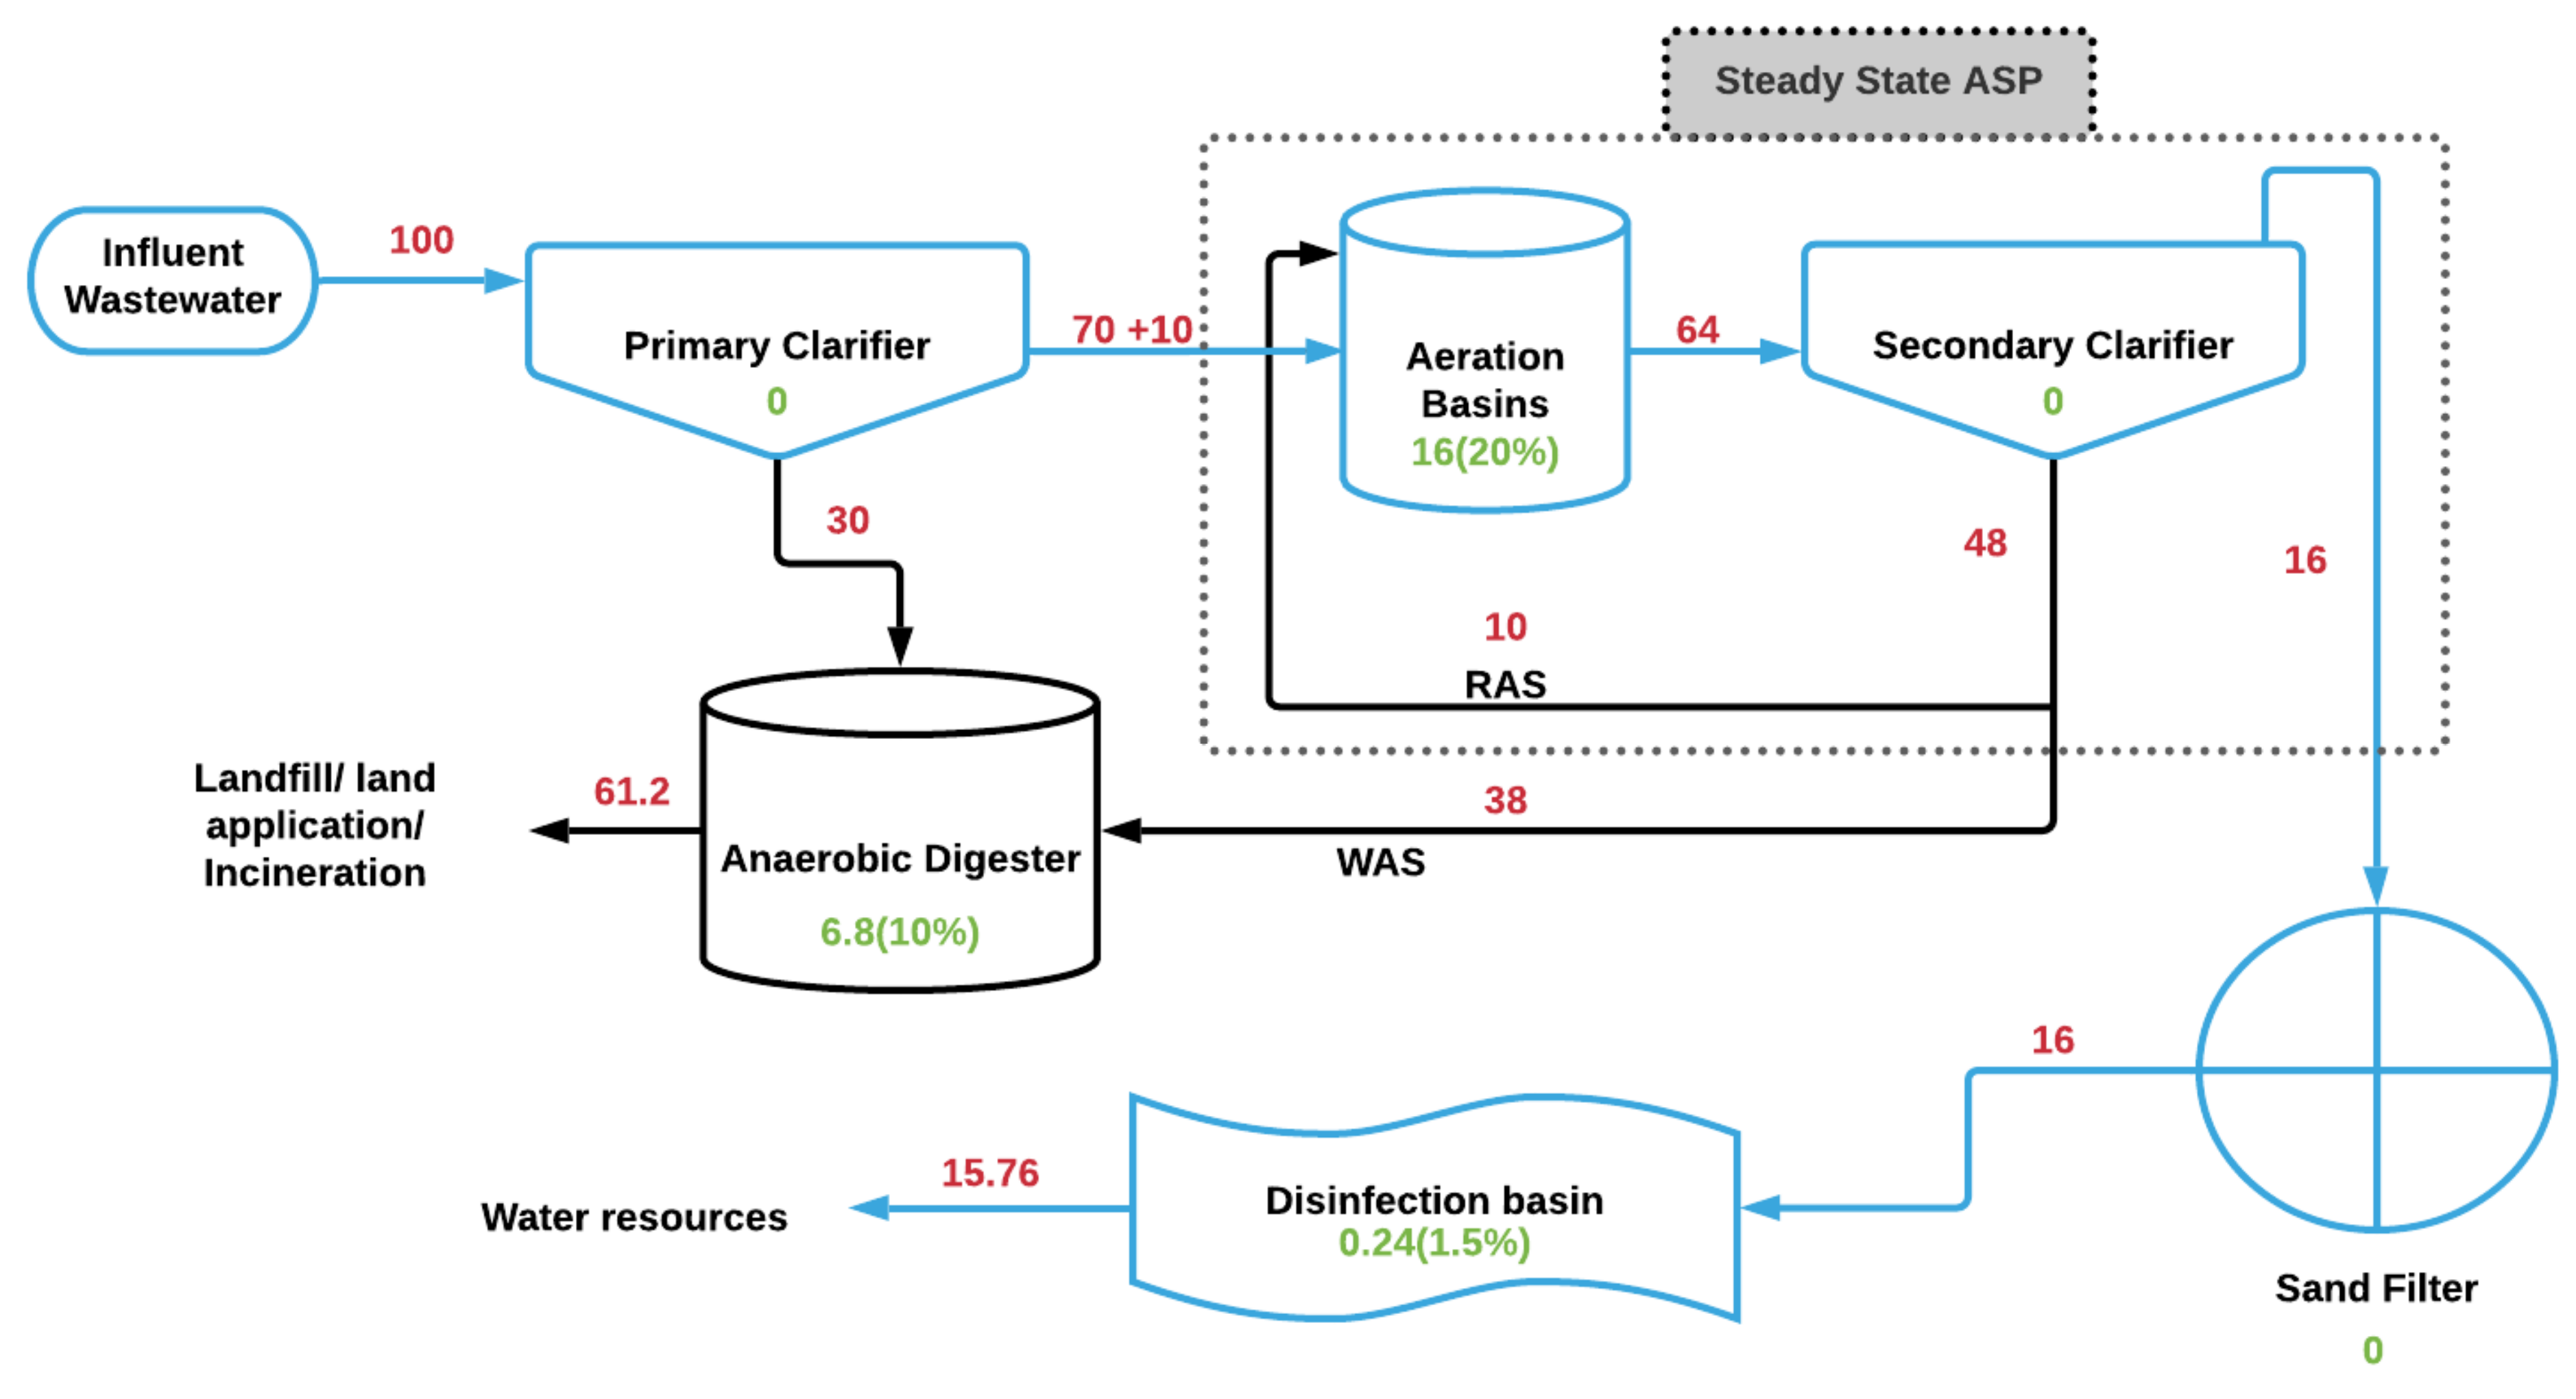
4. Estimated Mass Balance
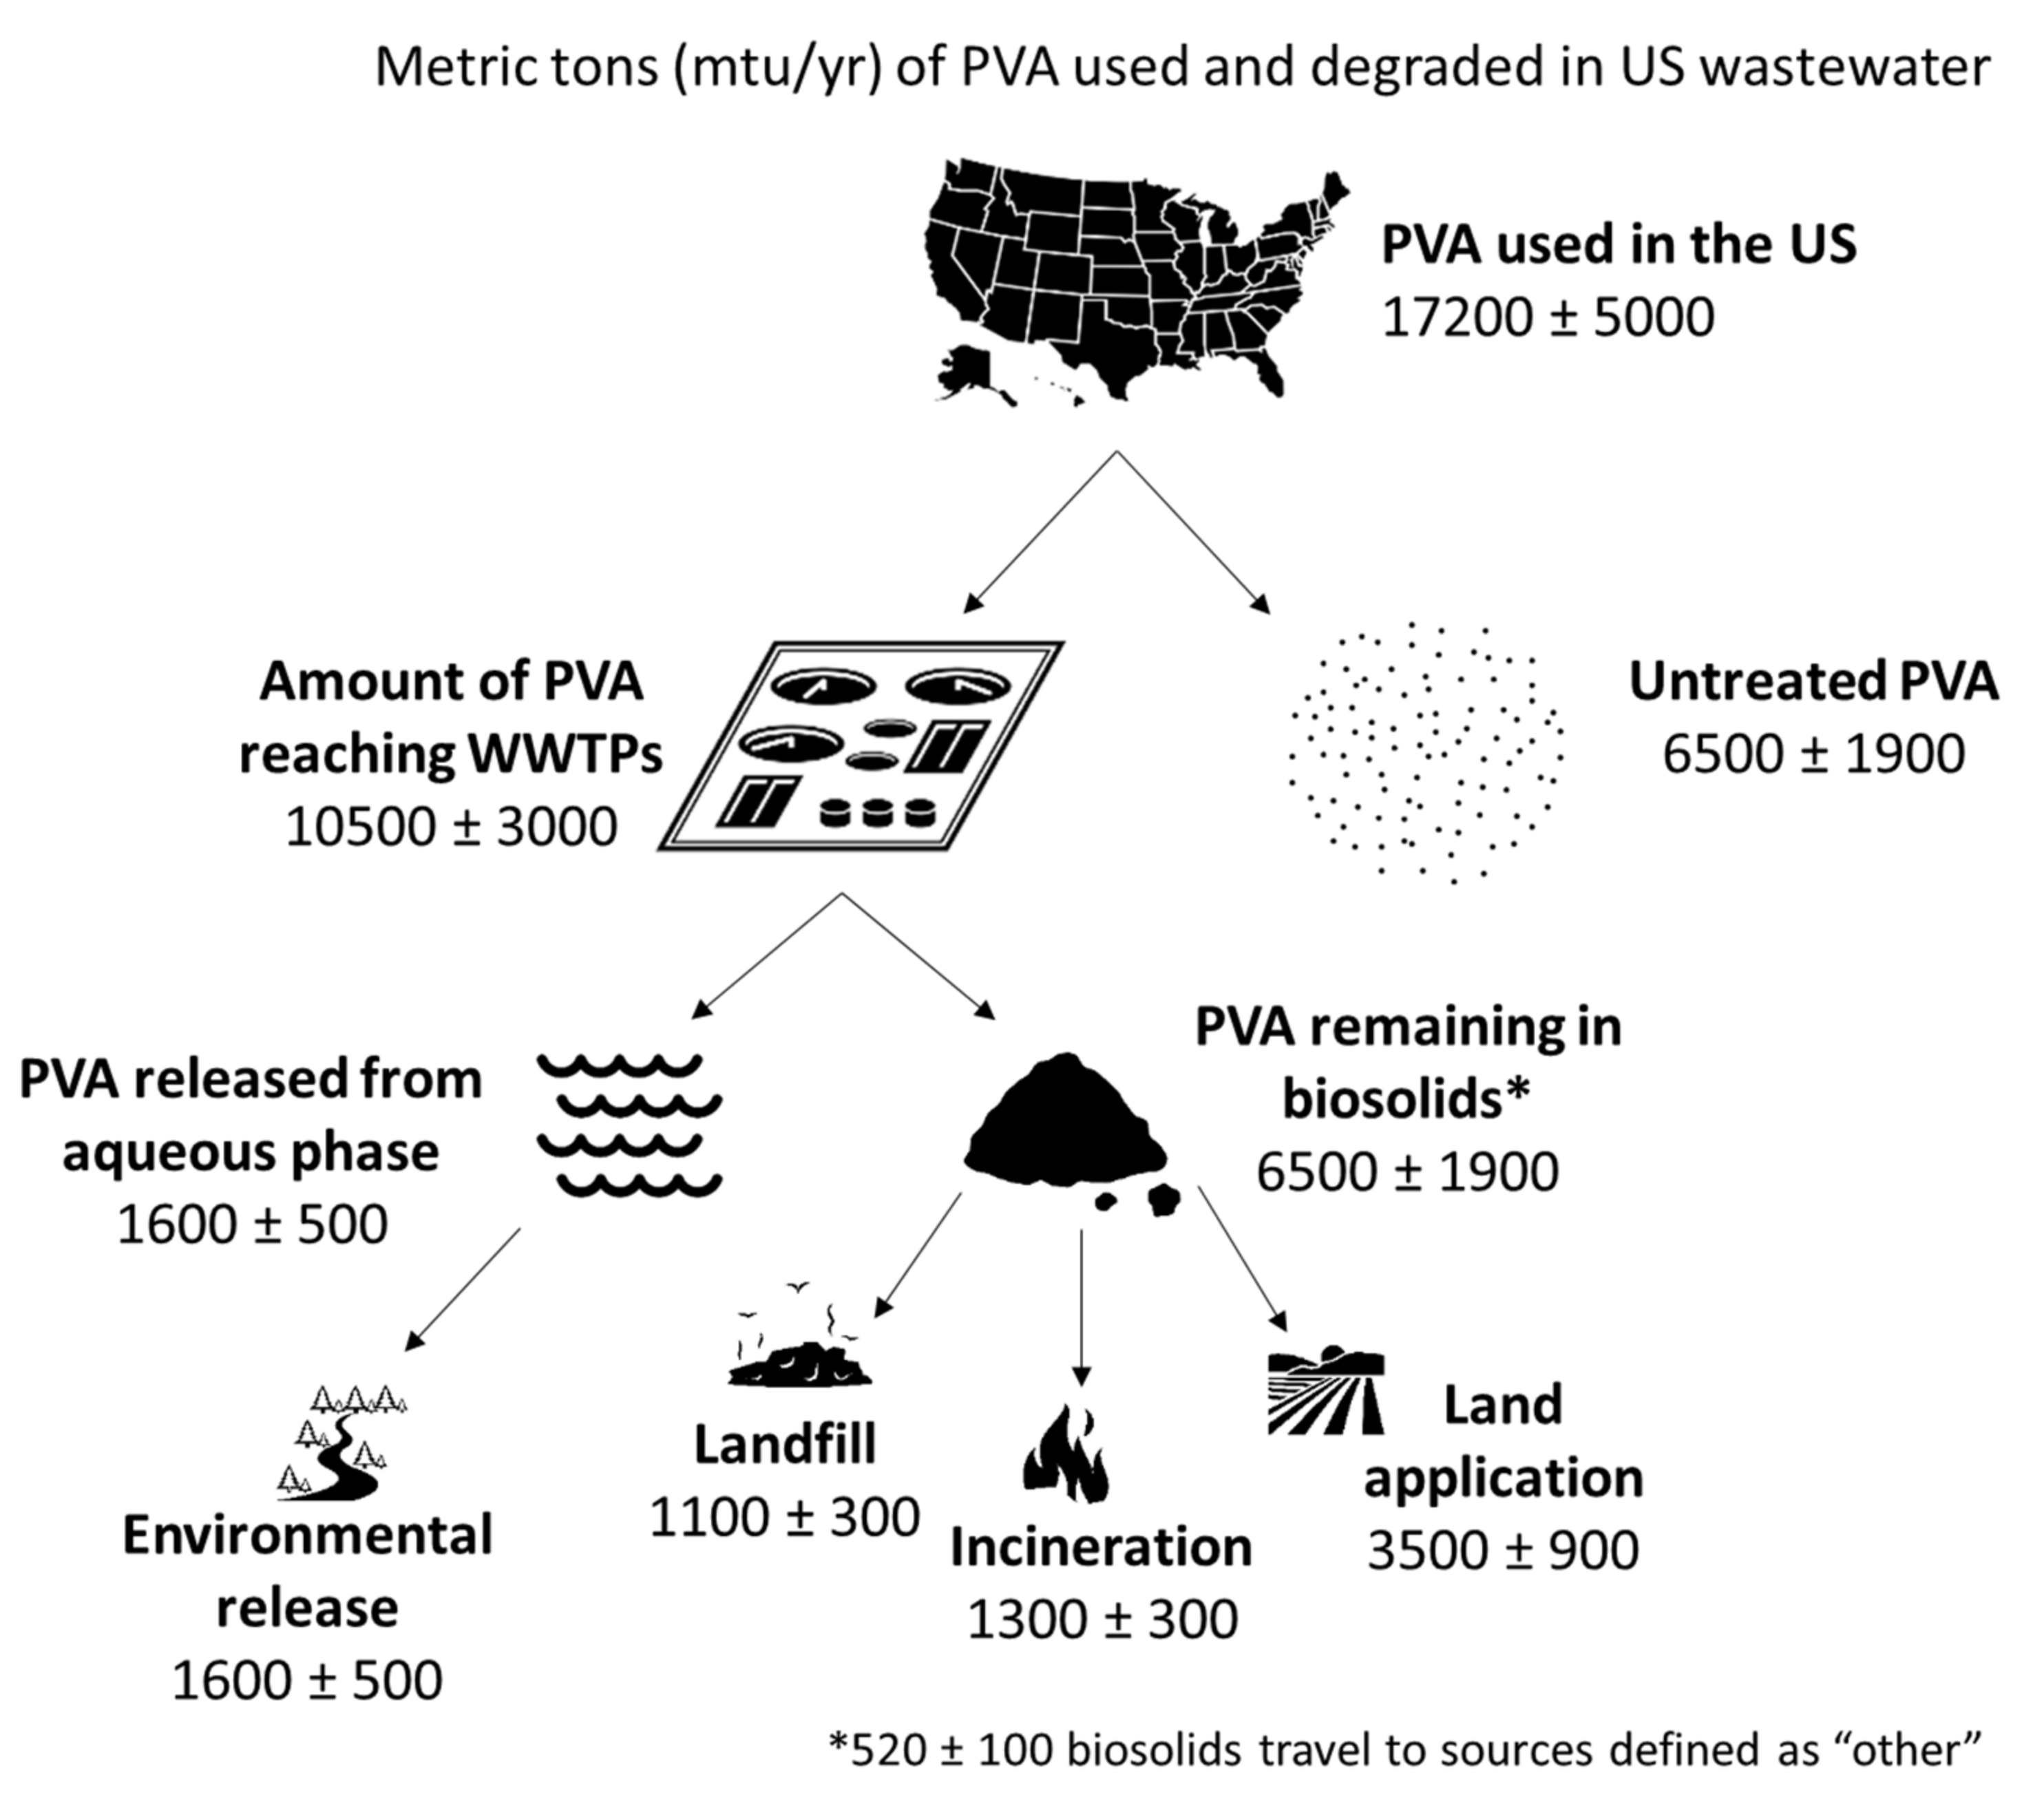
5. Nationwide PVA Emissions via WWTPs (Effluent + Biosolids)
6. Implications
Supplementary Materials
Author Contributions
Funding
Institutional Review Board Statement
Informed Consent Statement
Data Availability Statement
Acknowledgments
Conflicts of Interest
References
- Wilcox, C.; Van Sebille, E.; Hardesty, B.D. Threat of plastic pollution to seabirds is global, pervasive, and increasing. Proc. Natl. Acad. Sci. USA 2015, 112, 11899–11904. [Google Scholar] [CrossRef] [PubMed] [Green Version]
- Calabrò, P.S.; Grosso, M. Bioplastics and waste management. Waste Manag. 2018, 78, 800–801. [Google Scholar] [CrossRef] [PubMed]
- DeMerlis, C.; Schoneker, D. Review of the oral toxicity of polyvinyl alcohol (PVA). Food Chem. Toxicol. 2003, 41, 319–326. [Google Scholar] [CrossRef]
- Xu, S.; Malik, M.A.; Qi, Z.; Huang, B.; Li, Q.; Sarkar, M. Influence of the PVA fibers and SiO2 NPs on the structural properties of fly ash based sustainable geopolymer. Constr. Build. Mater. 2018, 164, 238–245. [Google Scholar] [CrossRef]
- GlobeNewsWire. Polyvinyl Alcohol (PVA) Market Size Worth $1.76 Bn by 2023 Witnessing a CAGR of 4.09% during 2018 to 2023—Market Research Future; GlobeNewsWire: Los Angeles, CA, USA, 2018. [Google Scholar]
- Tokiwa, Y.; Kawabata, G.; Jarerat, A. A modified method for isolating poly (vinyl alcohol)-degrading bacteria. Biotechnol. Lett. 2001, 23, 1937–1941. [Google Scholar] [CrossRef]
- Yamatsu, A.; Matsumi, R.; Atomi, H.; Imanaka, T. Isolation and characterization of a novel poly(vinyl alcohol)-degrading bacterium, Sphingopyxis sp. PVA3. Appl. Microbiol. Biotechnol. 2006, 72, 804–811. [Google Scholar] [CrossRef] [PubMed]
- Druege, U. Ethylene and plant responses to abiotic stress. Ethyl. Action Plants 2006, 81–118. [Google Scholar] [CrossRef]
- Shan, J.; Guan, Y.; Zheng, Q.; Han, J.; Liu, Q.; Pu, Z. Application of urea/H2O2activation-oxidation system in degradation of PVA and desizing of polyester/cotton fabric. J. Appl. Polym. Sci. 2009, 113, 860–867. [Google Scholar] [CrossRef]
- Sun, W.; Tian, J.; Chen, L.; He, S.; Wang, J. Improvement of biodegradability of PVA-containing wastewater by ionizing radiation pretreatment. Environ. Sci. Pollut. Res. 2012, 19, 3178–3184. [Google Scholar] [CrossRef]
- Cole, M.; Lindeque, P.; Halsband, C.; Galloway, T.S. Microplastics as contaminants in the marine environment: A review. Mar. Pollut. Bull. 2011, 62, 2588–2597. [Google Scholar] [CrossRef]
- Li, J.; Zhang, K.; Zhang, H. Adsorption of antibiotics on microplastics. Environ. Pollut. 2018, 237, 460–467. [Google Scholar] [CrossRef]
- Brennecke, D.; Duarte, B.; Paiva, F.; Caçador, I.; Canning-Clode, J. Microplastics as vector for heavy metal contamination from the marine environment. Estuar. Coast. Shelf Sci. 2016, 178, 189–195. [Google Scholar] [CrossRef]
- Lei, L.; Hu, X.; Yue, P.L.; Bossmann, S.H.; Göb, S.; Braun, A.M. Oxidative degradation of poly vinyl alcohol by the photochemically enhanced Fenton reaction. J. Photochem. Photobiol. A Chem. 1998, 116, 159–166. [Google Scholar] [CrossRef]
- Sun, W.; Chen, L.; Wang, J. Degradation of PVA (polyvinyl alcohol) in wastewater by advanced oxidation processes. J. Adv. Oxid. Technol. 2017, 20. [Google Scholar] [CrossRef]
- Hollman, P.C.H.; Bouwmeester, H.; Peters, R.J.B. Microplastics in Aquatic Food Chain: Sources, Measurement, Occurrence and Potential Health Risks; RIKILT-Institute of Food Safety: Wageningen, The Netherlands, 2013; No. 2013.003. [Google Scholar]
- Nimonkar, Y.S.; Yadav, B.; Talreja, P.; Sharma, A.; Patil, S.; Saware, S.S.; Ranade, D.R.; Prakash, O. Assessment of the role of wastewater treatment plant in spread of antibiotic resistance and bacterial pathogens. Indian J. Microbiol. 2019, 59, 261–265. [Google Scholar] [CrossRef]
- Chemicals, S.S. SelvolTM Polyvinyl Alcohol Product Information. Available online: https://www.sekisui-sc.com/products/polyvinyl-alcohol/ (accessed on 12 February 2021).
- United States Patent Application. Process of Making a Water Soluble Pouch. Available online: https://patents.google.com/patent/US20160340068A1/en (accessed on 2 June 2021).
- Chiellini, E.; Corti, A.; D’Antone, S.; Solaro, R. Biodegradation of poly (vinyl alcohol) based materials. Prog. Polym. Sci. 2003, 28, 963–1014. [Google Scholar] [CrossRef]
- Julinová, M.; Vaňharová, L.; Jurča, M. Water-soluble polymeric xenobiotics—Polyvinyl alcohol and polyvinylpyrrolidone—And potential solutions to environmental issues: A brief review. J. Environ. Manag. 2018, 228, 213–222. [Google Scholar] [CrossRef] [PubMed]
- Hoffmann, J.; Řezníčková, I.; Kozáková, J.; Růžička, J.; Alexy, P.; Bakoš, D.; Precnerová, L. Assessing biodegradability of plastics based on poly (vinyl alcohol) and protein wastes. Polym. Degrad. Stab. 2003, 79, 511–519. [Google Scholar] [CrossRef]
- Watanabe, Y.; Morita, M.; Hamada, N.; Tsujisaka, Y. Formation of hydrogen peroxide by a polyvinyl alcohol degrading enzyme. Agric. Biol. Chem. 1975, 39, 2447–2448. [Google Scholar] [CrossRef]
- Kawai, F.; Hu, X. Biochemistry of microbial polyvinyl alcohol degradation. Appl. Microbiol. Biotechnol. 2009, 84, 227–237. [Google Scholar] [CrossRef]
- Halden, R.U.; Paull, D.H. Co-Occurrence of triclocarban and triclosan in U.S. Water Resources. Environ. Sci. Technol. 2005, 39, 1420–1426. [Google Scholar] [CrossRef] [PubMed]
- Dieter, C.A.; Maupin, M.A.; Caldwell, R.R.; Harris, M.A.; Ivahnenko, T.I.; Lovelace, J.K.; Barber, N.L.; Linsey, K.S. Estimated use of water in the United States in 2015. In U.S. Geological Survey Circular 1441; U.S. Geological Survey: Reston, VA, USA, 2017; ISBN 9781411342330. [Google Scholar]
- Kaur, R.; Wani, S.P.; Singh, A.K.; Lal, K. Wastewater production, treatment and use in India. In Proceedings of the 2nd Regional Workshop on Safe Use of Wastewater in Agriculture, New Delhi, India, 16–18 May 2012; pp. 1–13. [Google Scholar]
- US Environmental Protection Agency. The Sources and Solutions: Wastewater; US Environmental Protection Agency: Washington, DC, USA, 2019.
- Nigel Patrick, S.R. Water Soluble Pouches. Canada Patent CA2463025C, 21 October 2008. [Google Scholar]
- Sonune, A.; Ghate, R. Developments in wastewater treatment methods. Desalination 2004, 167, 55–63. [Google Scholar] [CrossRef]
- Magdum, S.S.; Minde, G.P.; Kalyanraman, V. Rapid determination of indirect cod and polyvinyl alcohol from textile desizing wastewater. Pollut. Res. 2013, 32, 515–519. [Google Scholar]
- Katsoyiannis, A.; Zouboulis, A.; Samara, C. Persistent organic pollutants (POPs) in the conventional activated sludge treatment process: Model predictions against experimental values. Chemosphere 2006, 65, 1634–1641. [Google Scholar] [CrossRef] [PubMed]
- Farid, O.; Mansour, F.; Habib, M.; Robinson, J.; Tarleton, S. Investigating the sorption influence of poly(vinyl alcohol) (PVA) at different crosslinking content. J. Environ. Chem. Eng. 2016, 4, 293–298. [Google Scholar] [CrossRef]
- Brandt, E.M.; de Queiroz, F.B.; Afonso, R.J.; Aquino, S.; Chernicharo, C.A. Behaviour of pharmaceuticals and endocrine disrupting chemicals in simplified sewage treatment systems. J. Environ. Manag. 2013, 128, 718–726. [Google Scholar] [CrossRef] [PubMed] [Green Version]
- Sun, M.; Lu, S. Polyvinyl alcohol treatment of textile wastewater under eco-environmental protection. Ekoloji 2019, 28, 2131–2140. [Google Scholar]
- Hamza, R.A.; Sheng, Z.; Iorhemen, O.T.; Zaghloul, M.S.; Tay, J.H. Impact of food-to-microorganisms ratio on the stability of aerobic granular sludge treating high-strength organic wastewater. Water Res. 2018, 147, 287–298. [Google Scholar] [CrossRef]
- State of Michigan Department of Environmental Quality. Activated Sludge Process Control Training Manual for Wastewater; Michigan Department of Environmental Quality: Lansing, MI, USA. Available online: https://www.michigan.gov/documents/deq/wrd-ot-activated-sludge-manual_460007_7.pdf (accessed on 2 June 2021).
- Schonberger, H.; Baumann, A.; Keller, W. Study of microbial degradation of polyvinyl alcohol (PVA) in wastewater treatment plants. Am. Dyest. Report. 1997, 86, 9–18. [Google Scholar]
- Kumar, K.; Singh, G.K.; Dastidar, M.; Sreekrishnan, T. Effect of mixed liquor volatile suspended solids (MLVSS) and hydraulic retention time (HRT) on the performance of activated sludge process during the biotreatment of real textile wastewater. Water Resour. Ind. 2014, 5, 1–8. [Google Scholar] [CrossRef] [Green Version]
- Sekisui Speciality Chemicals. SelvolTM Polyvinyl Alcohol Product Information; Sekisui Speciality Chemicals: Houston, TX, USA, 2016. [Google Scholar]
- Soriano, G.A.; Erb, M.; Garel, C.; Audic, J.M.; Aguilera, S.G. A Comparative pilot-scale study of the performance of conventional activated sludge and membrane bioreactors under limiting operating conditions. Water Environ. Res. 2003, 75, 225–231. [Google Scholar] [CrossRef]
- USEPA. Wastewater Technology Fact Sheet Chlorine Disinfection; USEPA: Washington, DC, USA, 1999.
- USEPA. Emerging Technologies for Wastewater Treatment and In-Plant Wet Weather Management; USEPA: Washington, DC, USA, 2012; pp. 1–144.
- Ye, B.; Li, Y.; Chen, Z.; Wu, Q.-Y.; Wang, W.-L.; Wang, T.; Hu, H.-Y. Degradation of polyvinyl alcohol (PVA) by UV/chlorine oxidation: Radical roles, influencing factors, and degradation pathway. Water Res. 2017, 124, 381–387. [Google Scholar] [CrossRef] [PubMed]
- Kelkar, V.P.; Rolsky, C.B.; Pant, A.; Green, M.D.; Tongay, S.; Halden, R.U. Chemical and physical changes of microplastics during sterilization by chlorination. Water Res. 2019, 163, 114871. [Google Scholar] [CrossRef] [PubMed]
- Four Effective Processes to Treat Wastewater. Available online: https://eponline.com/articles/2018/02/08/four-effective-processes-to-treat-wastewater.aspx (accessed on 3 January 2021).
- Drewes, J.E. Chapter 4.1 Removal of pharmaceutical residues during wastewater treatment. In Analysis, Removal, Effects and Risk of Pharmaceuticals in the Water Cycle—Occurrence and Transformation in the Environment; Elsevier: Amsterdam, The Netherlands, 2007; pp. 427–449. [Google Scholar] [CrossRef]
- Gao, P.; Ding, Y.; Li, H.; Xagoraraki, I. Occurrence of pharmaceuticals in a municipal wastewater treatment plant: Mass balance and removal processes. Chemosphere 2012, 88, 17–24. [Google Scholar] [CrossRef]
- Costa, A.; Ely, C.; Pennington, M.; Rock, S.; Staniec, C.; Turgeon, J. Anaerobic Digestion and Its Applications; USEPA: Washington, DC, USA, 2015; p. 15. [Google Scholar]
- Matsumura, S.; Kurita, H.; Shimokobe, H. Anaerobic biodegradability of polyvinyl alcohol. Biotechnol. Lett. 1993, 15, 749–754. [Google Scholar] [CrossRef]
- Russo, M.A.; O’Sullivan, C.; Rounsefell, B.; Halley, P.J.; Truss, R.; Clarke, W. The anaerobic degradability of thermoplastic starch: Polyvinyl alcohol blends: Potential biodegradable food packaging materials. Bioresour. Technol. 2009, 100, 1705–1710. [Google Scholar] [CrossRef]
- Pšeja, J.; Charvátová, H.; Hruzík, P.; Hrncirik, J.; Kupec, J. Anaerobic biodegradation of blends based on polyvinyl alcohol. J. Polym. Environ. 2006, 14, 185–190. [Google Scholar] [CrossRef]
- Garrido, J.M.; Fdz-Polanco, F. Working with energy and mass balances: A conceptual framework to understand the limits of municipal wastewater treatment. Water Sci. Technol. 2013, 67, 2294–2301. [Google Scholar] [CrossRef]
- West, A.W. Operational Control of The Return Activated Sludge; USEPA: Washington, DC, USA, 1973. [Google Scholar]
- Deslauriers, S.A.; Kanzaki, M.; Bulkley, J.W.; Keoleian, G.A. US Wastewater Treatment; Center for Sustainable System: Ann Arbor, MI, USA, 2020. [Google Scholar]
- Rolsky, C.; Kelkar, V.; Driver, E.; Halden, R.U. Municipal sewage sludge as a source of microplastics in the environment. Curr. Opin. Environ. Sci. Health 2020, 14, 16–22. [Google Scholar] [CrossRef]
- Venkatesan, A.K.; Halden, R.U. Brominated flame retardants in U.S. biosolids from the EPA national sewage sludge survey and chemical persistence in outdoor soil mesocosms. Water Res. 2014, 55, 133–142. [Google Scholar] [CrossRef] [Green Version]
- Hamad, D.; Mehrvar, M.; Dhib, R. Experimental study of polyvinyl alcohol degradation in aqueous solution by UV/H2O2 process. Polym. Degrad. Stab. 2014, 103, 75–82. [Google Scholar] [CrossRef]
- Chowdhury, N.K.; Ismail, A.F.; Beg, M.D.H.; Hegde, G.; Gohari, R.J. Polyvinyl alcohol/polysaccharide hydrogel graft materials for arsenic and heavy metal removal. New J. Chem. 2015, 39, 5823–5832. [Google Scholar] [CrossRef] [Green Version]
- Liu, G.; Zhu, Z.; Yang, Y.; Sun, Y.; Yu, F.; Ma, J. Sorption behavior and mechanism of hydrophilic organic chemicals to virgin and aged microplastics in freshwater and seawater. Environ. Pollut. 2019, 246, 26–33. [Google Scholar] [CrossRef]
- Spahr, S.; Teixidó, M.; Sedlak, D.L.; Luthy, R.G. Hydrophilic trace organic contaminants in urban stormwater: Occurrence, toxicological relevance, and the need to enhance green stormwater infrastructure. Environ. Sci. Water Res. Technol. 2019, 6, 15–44. [Google Scholar] [CrossRef] [Green Version]
- Wielsøe, M.; Long, M.; Ghisari, M.; Bonefeld-Jørgensen, E.C. Perfluoroalkylated substances (PFAS) affect oxidative stress biomarkers in vitro. Chemosphere 2015, 129, 239–245. [Google Scholar] [CrossRef]
- Alvarez-Campos, O.; Evanylo, G.K. Biosolids improve urban soil properties and vegetable production in urban agriculture. Urban Agric. Reg. Food Syst. 2019, 4, 1–11. [Google Scholar] [CrossRef]
- He, P.; Chen, L.; Shao, L.; Zhang, H.; Lü, F. Municipal solid waste (MSW) landfill: A source of microplastics? Evidence of microplastics in landfill leachate. Water Res. 2019, 159, 38–45. [Google Scholar] [CrossRef]
- Yang, Z.; Lü, F.; Zhang, H.; Wang, W.; Shao, L.; Ye, J.; He, P. Is incineration the terminator of plastics and microplastics? J. Hazard. Mater. 2021, 401, 123429. [Google Scholar] [CrossRef]
- Gallo, F.; Fossi, C.; Weber, R.; Santillo, D.; Sousa, J.; Ingram, I.; Nadal, A.; Romano, D. Marine litter plastics and microplastics and their toxic chemicals components: The need for urgent preventive measures. Environ. Sci. Eur. 2018, 30, 1–14. [Google Scholar] [CrossRef]


| Compound | RE (%) | log Kow |
|---|---|---|
| Ibuprofen | 21 [48] | 2.48 |
| Gemfibrozil | 17 [48] | 4.77 |
| Diclofenac | 9 [48] | 1 |
| Fenofibric acid | 5 [48] | 1.9 |
| Clofibric acid | 15 [48] | 2.88 |
| Carbamazepine | 1.4 [49] | 1.51 |
| Doxycycline | −13 [49] | −0.62 |
| Oxytetracycline | −33 [49] | −0.9 |
| Sulfadiazine | 7.7 [49] | −0.09 |
| Acetaminophen | −40 [49] | 0.46 |
| Sr. No. | Process | HRT (h) | SRT (days) | Other Conditions | Degradation (%) |
|---|---|---|---|---|---|
| 1 | Activated sludge process | 18–24 [42] | 12–15 [42] | F:M ratio: 0.25–0.45 [38] PVA unadapted sludge | 20 |
| 2 | Anaerobic digestion | NA | 25 [50] | 37 °C [50] PVA unadapted sludge | 10 |
| 3 | Disinfection | 0.5 [46] | NA | chlorination 20 mgCl2/L | 1.5 |
Publisher’s Note: MDPI stays neutral with regard to jurisdictional claims in published maps and institutional affiliations. |
© 2021 by the authors. Licensee MDPI, Basel, Switzerland. This article is an open access article distributed under the terms and conditions of the Creative Commons Attribution (CC BY) license (https://creativecommons.org/licenses/by/4.0/).
Share and Cite
Rolsky, C.; Kelkar, V. Degradation of Polyvinyl Alcohol in US Wastewater Treatment Plants and Subsequent Nationwide Emission Estimate. Int. J. Environ. Res. Public Health 2021, 18, 6027. https://doi.org/10.3390/ijerph18116027
Rolsky C, Kelkar V. Degradation of Polyvinyl Alcohol in US Wastewater Treatment Plants and Subsequent Nationwide Emission Estimate. International Journal of Environmental Research and Public Health. 2021; 18(11):6027. https://doi.org/10.3390/ijerph18116027
Chicago/Turabian StyleRolsky, Charles, and Varun Kelkar. 2021. "Degradation of Polyvinyl Alcohol in US Wastewater Treatment Plants and Subsequent Nationwide Emission Estimate" International Journal of Environmental Research and Public Health 18, no. 11: 6027. https://doi.org/10.3390/ijerph18116027