Termite-inspired metamaterials for flow-active building envelopes
 David Andréen
 Rupert Soar
- 1BioDigital Matter, Department of Architecture and Built Environment, Lund University, Lund, Sweden
- 2School of Architecture, Design, and the Built Environment, Nottingham Trent University, Nottingham, United Kingdom
In this article we investigate the performative potential of reticulated tunnel networks to act as drivers for selective airflows in building envelopes and thereby facilitate semi-passive climate regulation. We explore whether such transient flow can be used to create functionally graded metamaterials in bio-inspired, additively fabricated buildings. The tunnel networks are modelled on the egress complex found in the mound of certain macrotermite species. The hypothesis we explore is that oscillating airflow of low amplitude can be used to generate large scale turbulence within the network and thereby increase the mass transfer rates across the network. The hypothesis is tested through a series of 3-dimensional and 2-dimensional experiments where various geometries are exposed to a forced oscillation of the air or water column. The results are evaluated in the 3-dimesional experiments through tracer gas measurements, and in the 2-dimenstional experiments through visual qualitative assessment using fluorescein dye. We find that the oscillating fluid gives rise to large scale turbulence that causes a net mass transport across the tunnel network, and that this turbulence occurs when certain combinations of amplitude, frequency, and network geometry are achieved. Furthermore, we conclude that the net mass transfer is large enough to be functionally useful in a building envelope as a method to regulate either building interior climate or the envelope’s own microclimate.
1 Introduction
Emerging technologies in additive fabrication and computational design are opening up radical new possibilities for performative building envelopes, where intricate and (micro)site-specific geometries can enable the creation of functionally graded metamaterials (Soar and Andréen, 2012). Metamaterials are materials shaped in ways that give them properties not exhibited in their naturally occurring conditions. They have long been a concept meaningful primarily in small-scale, high-value engineering such as electronics or more recently mechanical engineering. However, with the emergence of additive fabrication technologies capable of producing complex geometries even at large volumes (current state-of-the-art powder bed printers can produce objects up to 8 cubic meters overnight, with exceptionally high resolution), there is a growing opportunity to implement these concepts in the construction industry.
In this paper we explore how such functionally graded metamaterials can potentially be modelled on the structures found in termite mounds. The large mound structures are created by termites to act as physiological organs that, through their complex and functional internal geometry, regulate significant flows of respiratory gases and maintain an internal microclimate with steep gradients in humidity and temperature towards the outside (Heyde et al., 2021). They gain their function primarily from geometry and can adapt to a surprising range of surrounding environments. Biological systems exhibit a strong coherence between form and function, and are able to draw benefits from highly complex and specific form. They can serve as a model not only for the direct relationship between form and performance, but also for the generative processes that enable organisms to produce such structures (Andréen and Goidea, 2022; Goidea et al., 2022).
The hypothesis tested in this paper is that the tunnel network found in the envelope of the mound can, when activated by transient air movements, generate a useful and controllable mass transport across the envelope. If such a flow can be selectively created within and across a permeable structure, it may provide a useful tool for semi-passive regulation of building climates and building envelope microclimates. The ambition of the paper is to provide a proof-of-concept for previously undocumented mechanisms and establish what geometric parameters can be used to control the effects.
2 Materials and methods
The experiments reported here are based on the geometric structure of a section of a termite mound, the so-called egress complex. The exact function(s) of this structure are undetermined, but it is speculated that they play a role in the air exchange between the interior and exterior of the mound.
2.1 Physiology of the termite colony
The numerous species of termite of the genus Macrotermitinae (order Isoptera–a subfamily of the higher termites or Termitidae) and their co-dependent species of Termitomyces fungus, are known for an ability to construct mounds whose structures are tied to approximating a stable internal environment conducive to a resident colony of typically millions of termites and the extensive metabolic presence of the fungus (Ruelle, 1964; Darlington et al., 1997).
Construction of the mound is not linear; it is continuous and negotiated fiercely. Termites accrete a structure to support a multiplicity of process components, many set in opposition, where agents execute process strategies which satisfy a varying and dynamic environment. The mound is therefore a device by which a metabolic potential is established between the inside and outside to drive energy, matter and information flow in both directions (Turner, 2000a; Turner, 2005). For this to happen, the mound must actively engage with a potential energy source from its external environment.
In 2000, Turner introduced and described the mound as an organ of physiology (Turner, 2000b; 2001) which addressed the discord between transient air flow movements he measured within Macrotermitinae mounds in southern Africa and the accepted theory of a “steady state” convective driven stack-effect or thermosiphon principle established in the 1950s (Lüscher, 1961). In place of steady-state ventilation, Turner proposed a model in which the mound (and nest) isolates its respiratory requirements from those of stasis of the internal environment (i.e., eliminating bulk flow ventilation) through a three phase respiratory or tidal gas exchange system. In this model, the reticulated gradient of ducts which permeate the mound surface are one of the phases, dominated by transient forced convection (Turner and Soar, 2008).
Wind acting on and around the mound surface is unpredictable, turbulent, and often weak (<1 m/s). As turbulent wind encounters the reticulated surface channels, which permeate primarily the north facing aspect of the mound during the rainy season (the egress complex), it is hypothesized that it results in pressure differentials which change rapidly both spatially and temporally. It may be that this transient pressure state, created and enhanced through the geometry of the surface channels, provides the energy for mass transfer which may include evapotranspiration during the growing season or respiratory gas exchange, primarily within the egress reticulum but also potentially deeper inside the termite mound.
2.1.1 Egress complex
In M. michaelseni the egress complex (EC) is located predominantly on the north facing aspect of the spire and extends part way down the basal cone of the mound. The EC emerges at certain times of year, primarily during the growing season when activity in the colony is at its peak and moving towards alate release. It is also the wetter season, when an increased humidity of the surface clay may reduce the potential diffusive flow through the permeable mound skin, necessitating the opening of direct air channels. It is effectively the only opening between the mound and the external environment.
A sample from the EC structure of a termite mound from the species M. michaelseni was retrieved from a study site at the Omatjenne Research Station, near Otjiwarongo, Namibia in February 2005. It was removed from the upper part of the mound’s distinctive spire, from the mound’s north facing side. The sample was retrieved at a time of year when active modification of the mound exterior is at its peak.
The sample was heavily permeated by a gradient of reticulated channels, varying in cross section, length and number, with fewer large (∼15-25 mm diameter) channels towards the interior and more frequent smaller (∼3-5 mm diameter) channels penetrating the exterior surface. To understand and quantify the relationship and connectivity of nodes and edges within this network, the sample was digitally scanned using computed tomography (CT) at Nottingham University Hospital, and the resulting mesh is shown in Figure 1. The lower part of the figure shows the inverse mesh where the internal voids show up as solids to visualize the interconnections of the reticulated and hierarchical lattice structure of nodes and edges. CT scanning was set to 0.5 mm slice thickness from which a surface approximation was generated from the Dicom data. The volume of the solids of the sample (mud material) was 1.42 L, and the void (air) volume was 0.23 L, a void to solid ratio of approximately 1:6. The network exhibited a valence (number of edges connected to each node) of approximately 3-4 on average, but with some nodes having a valence as high as 7. The edge length varied between 6 and 42 mm, with most lengths falling in the 10-20 mm range. The connections are shorter nearer the outside, and each node has a greater number of neighbours. The channel thickness is inversely correlated, with the channels near the mound surface being the thinnest and the ones near the surface conduits are thicker. The channels are smooth and gently curved, and most are roughly circular in cross section.
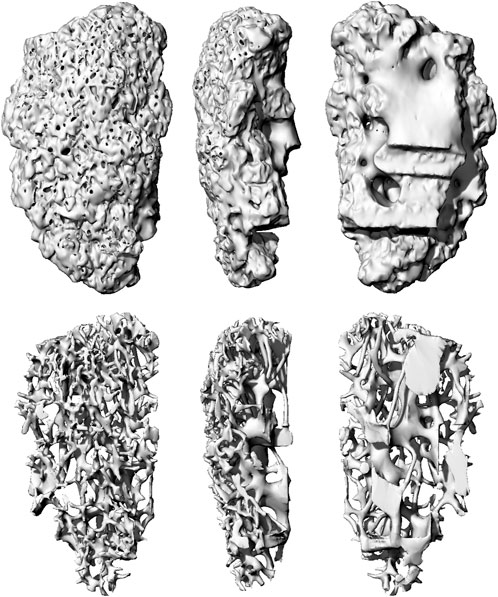
FIGURE 1. Computed tomography (CT) scan of egress complex: front, right, and back view. Lower images show negative space, highlighting the geometry of the reticulated tunnel network. The EC is approximately 300 mm high.
2.2 Materials and methods
Two sets of experiments were conducted. First, we drove an oscillating column of air across the EC while tracking the mass transfer rate through the EC using a tracer gas and sensor. In the second set of experiments we created a flat analogue of the EC using a 2-dimensional topology, and drove an oscillating body of water across the reticulum. The resulting flow was documented through the use of a fluorescent dye and video camera, allowing the flows to be examined in both still and video images.
In the experiments using the mound EC, in order to increase repeatability of the experiments and to avoid damage and erosion of the original sample, a 3D printed replica was used. This was fabricated from the scan data using selective laser sintering (SLS) process from nylon polymer powder. In order to isolate geometric dependencies from material ones and for practical reasons, the nylon EC was used for most experiments, except in a comparative study between the two materials, which is not described here, where the material was found to have negligible effects on the results.
2.2.1 Oscillation-induced mass transfer
The egress complex was mounted in timber frames. The frames were attached to a sealed chamber on the side of the EC which had faced the inside of the mound, so that the only connection between the chamber and the external air was through the channels in the EC. The volume of this chamber was 12.8 L.
In order to set up a regularly oscillating air column across the EC, an electronically controlled membrane (in the form of a loudspeaker) was coupled to the “outer” face of the EC via a chamber consisting of a box to house the EC sample and a 1,250 mm length of 100 mm Ø pipe (which housed the speaker) as shown in Figure 2. The pipe was introduced to stabilize the oscillation movements. The volume of this “outer” (sink) chamber was 7.4 + 9.9 L (the greater measure being the volume of the tube) for a total of 17.3 L.
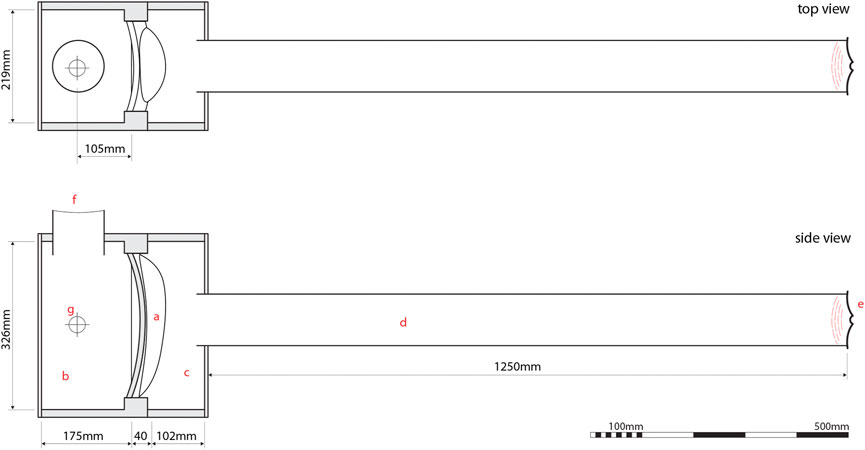
FIGURE 2. Induced oscillations 3D experiment set up. The egress complex (A) was mounted between two boxes (B and C). A pipe [d (diameter 100 mm, length 1250 mm)] was mounted on the “outside” of the EC, and a speaker (E) was attached to the end of the pipe. On the inside (B), an opening covered by a seal of loose PVC-film allowed for air movement as the speaker was active while keeping the outside air from entering the chamber (F). A Cozir Wide Range CO2 sensor (G) was placed in the middle of the chamber. The volumes of the chambers were: (B) 12.8L, (C) 7.42L, and (D) 9.9L. The thickness of the egress complex is 39 mm on average. The cross-section area of the channels at the outside face of the EC is estimated to 1700 mm*102 which increases towards the inner face where the end of the EC is not clearly defined.
The test chamber at the “inside” of the EC featured a 100 mm diameter opening, which allowed for purging with approximately 7,000 ppm CO2 air (the CO2 was used as a tracer gas to calculate air change rate) before each run and was covered and sealed with a loose sheet of thin PVC film so that the air inside this chamber would oscillate freely with the action of the speaker on the other side. A Cozir Wide Range sensor 0%-60% (accuracy ±70 ppm ± 5% of reading and with a response time of 4s) which recorded CO2 concentrations at 1 s intervals was mounted inside the test chamber.
The speaker gain control was set to drive the air at an amplitude of approximately 5 mm through the channels in the EC, and the speaker output remained constant through the experiment except where the amplitude was stated to be different. This means the oscillating air displacement was less than 10% of the total depth of the EC panel, and there was no net bulk flow. Frequencies between 10 Hz and 120 Hz were tested, beyond which no significant gas exchange took place.
As the membrane drove the air column across the EC, the concentration of CO2 in the test chamber was recorded and compared to a baseline gas exchange. The baseline exchange rate was a measure of mass transfer across the EC from the “source” to the “sink” where there was no motion (or rather minimal motion as some convection currents will be impossible to eliminate) of the air column, therefore limited to diffusion rates, or an approximation thereof. The mass transfer was measured using a standard air change rate (ACH) calculation for ventilation purposes, based on CO2 decay over time. The natural logarithm of CO2 concentration was plotted against time, where the slope of the best fit is the air change rate, which is obtained through linear regression. As the net bulk flow is 0 in the experiment set up, this calculation provides a measure of what the equivalent steady cross flow would have been to accomplish the same CO2 mixing between the two chambers (Sherman, 1990). Knowing the volume of the source chamber, the ACH can also be expressed as equivalent continuous flow per second. The advantages of the method are that the results are independent of the start concentration, the tracer gas is inert and easy to obtain, and no direct flow measurements are required.
Potential downsides are that the method assumes a constant exchange rate and homogeneous mixing of the source chamber, and provides no detail of the internal flow in the EC. In addition, because of the limited volume of the sink chamber, the flow rate will be underestimated as the method assumes an infinite volume sink. However, it is the relative air change rates which are of interest to the study, and as the constraints are uniformly applied to all test run, the limitations were not considered problematic. The exception to the uniform conditions between the experiments was a slight variation of the initial CO2 concentration in the sink chamber which was 550 ppm ± 150 ppm. This was due to experimental variation and human error but does not affect the calculated air change rate.
Apart from testing a range of frequencies, we also recorded the effects of altering the amplitude of the oscillations at a constant frequency. In this test the amplitude was doubled to approximately 10 mm.
Finally, the flow during a frequency sweep between 100 and 10 Hz was recorded with a video camera where visualization was assisted using a planar laser and smoke.
2.2.2 Oscillation-induced mass transfer in 2-dimensional environments
In order to understand the potential role of the transient mass transfer investigated here in the termite mound, or how they may be applied in other contexts, it is not only relevant to quantify the rate of mass transfer from inside to outside, but also to qualitatively understand the nature of the flow. To accomplish this, we created a flat analogy of a simplified network of reticulated tunnels using transparent acrylic plastic. In order to facilitate visualization, water was used as a medium rather than air, with fluorescein added to trace flow using a video camera. Fluorescein (C20H12O5) is a strong dye which glows with a green light when exposed to ultraviolet light, (Walker, 1987), and which allows for concentrations and flows to be traced in the system.
As the investigated system is transient, extra consideration has to be taken towards the dynamic similarity of the experiments, as they are affected by the change of medium and scale. In addition to the Reynolds number, the Womersley number should be considered (Loudon and Tordesillas, 1998) It is a dimensionless number used to describe the relationship between oscillating flow frequency and viscous properties of fluids. It is expressed as α = L (ω/v)½ where α is the Womersley number, ω is the frequency, and v is the kinematic viscosity. For similarity between the systems to remain, the Womersley number should be unchanged. For this to be achieved ω and v must be scaled identically (the length scale is constant in the two experiments). The kinematic viscosity of water at 20°C is 1.00*10-6 m2/s whereas the equivalent viscosity of air is 15.1*10-6 m2/s. Oscillations of 30 Hz in air should therefore be dynamically similar to 2 Hz oscillations in water.
Figure 3 shows how the experiment was set up. A test chamber was created from three layers of transparent acrylic of 5 mm thickness. The middle layer was cut using a laser cutter in order to achieve the desired geometry, with two chambers, a) and b) separated by a channel network c). The right chamber was connected through a plastic tube e) to a cylinder and piston f) driven by an electric motor g) through a crank arm, which was used to create an oscillating motion in the fluid. The motor operates at a frequency of up to 6 Hz, and a replaceable crankshaft allows for a stroke length of 2 or 4 mm. The cylinder has a diameter of 20 mm. During operation, it was noted that the electric motor and crank arm moved slightly laterally, effectively reducing the amplitude of the oscillations. As a result, the amplitude was measured by tracing a small air bubble placed in the plastic tube e). The volume of a full stroke was recorded as 0.4 mL for the shorter stroke and 1.2 mL for the longer stroke. The left chamber is connected to the ambient atmosphere, allowing for the unencumbered motion of the fluid in response to the piston movement.
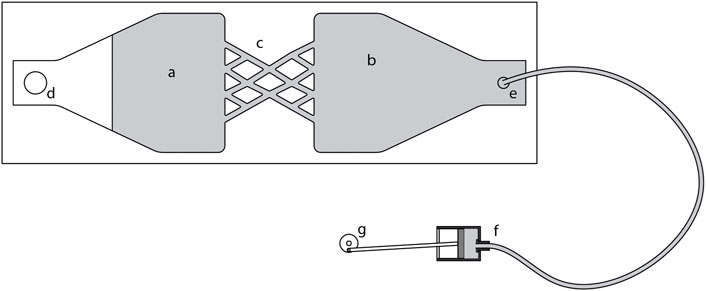
FIGURE 3. 2D experiment set-up. The chamber is filled with water. Left chamber (A) is open to atmosphere through (D). Right chamber (B) is connected to left chamber through a network of tunnels (C), and to a piston (F) through a tube (E). Piston is is driven from an electric motor (G) at 6 Hz.
Three different geometries were tested in the experiments, shown in Figure 4: a simple reticulated network, a series of straight connections, and a deeper reticulated network with a larger number of nodes. These were chosen for reasons to provide a simplified but reasonably similar analogy of the EC network in the case of the reticulated networks, and to provide a baseline without reticulation or branching in the case of the straight channel geometry, to which the results for the others could be compared and contrasted. The different geometries were exposed to varying oscillations: in the first case with variable frequency and in the second constant frequency at two different and fixed amplitudes.
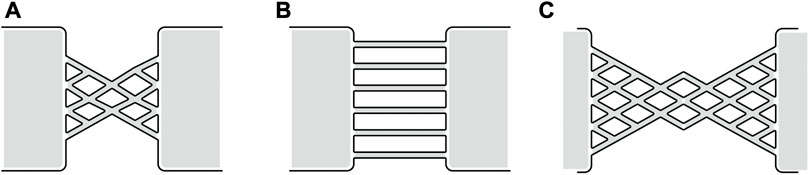
FIGURE 4. List and description of investigated geometries. (A) Geometry A. Narrow reticulation. Total width 80 mm, edge (node-to-node) length 23 mm, edge count 20. (B) Geometry B. Straight channels. Total width 80 mm, edge (node-to-node) length 80 mm, edge count 6. (C) Geometry C. Wide reticulation. Total width 160 mm, edge (node-to-node) length 23 mm, edge count 44.
The behavior of the fluids was recorded using a video camera, and the results are presented here as video files and still images.
3 Results
3.1 Oscillation-induced mass transfer in 3-dimensional environments
3.1.1 Frequency variations
Figure 5 shows the natural logarithm of the CO2 concentrations for the various oscillation frequencies. The calculated mass transfer rates as equivalent flow is shown in Figure 6. The baseline, or natural diffusion rate was measured to 3.3 × 10⁻³ L/s. The strongest response was found around 40 Hz, where the equivalent airflow was 1.6 × 10⁻² L/s. Above 100 Hz and below 10 Hz, the effect of oscillation induced mass transfer was negligible and within the error margin from the measured mass transfer rate at no oscillation. These results exhibit relatively high variability, particularly around the peak near 40 Hz. This is likely at least due to inconsistencies in the experimental protocol, and further data points would be necessary to reveal more about the mechanisms involved and the sensitivity towards frequency. At a general level the results consistently indicate a strong impact of frequency on the mass transfer rate.
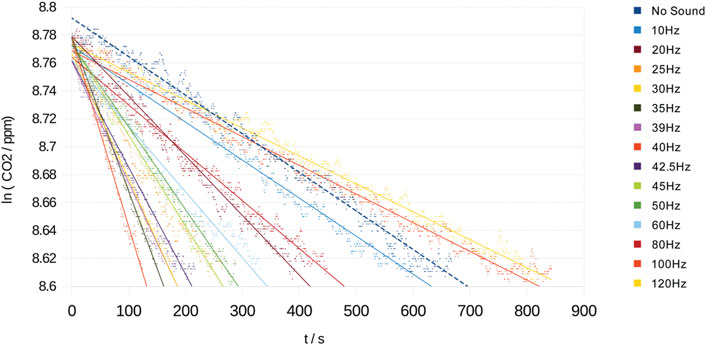
FIGURE 5. Frequency comparison. CO2 decay under different oscillation frequencies, amplitude constant. Dashed regression line shows 0 Hz/no sound. Average R2 of linear regressions equals 0.98.
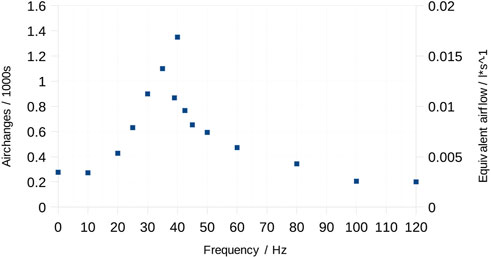
FIGURE 6. Mass transfer rate at different oscillation frequencies.
The resulting flows are shown in Supplementary Video S1, which is taken by a camera positioned in the inner chamber, perpendicular to the EC. A still image from the video is shown in Figure 7. This shows the formation of several vortices travelling away from the EC, in a typical vortex street fashion.
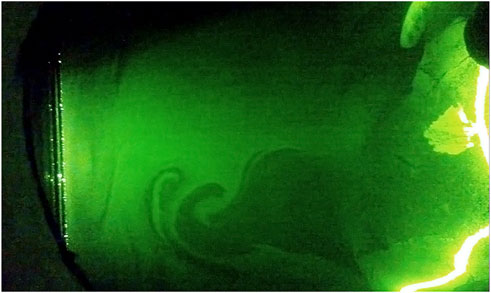
FIGURE 7. Still from Supplementary Video S1. Formation of jet at orifice during frequency sweep.
3.1.2 Amplitude variations
The tests were repeated at an amplitude of 10 mm and were compared to that of 5 mm (Figure 8). There is a considerable effect of amplitude, with a peak mass transfer rate at 5.0 × 10⁻² L/s, roughly four times higher for a doubling of the amplitude. In addition, the peak was wider, giving a stronger effect around a broader spectrum of frequencies and was slightly shifted to higher frequencies.
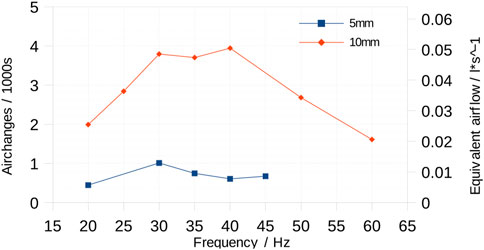
FIGURE 8. Amplitude comparison. Square markers show original set-up with an oscillation amplitude at approximately 5 mm. Diamond markers show same test with approximately doubled amplitude of the air oscillations.
3.2 Oscillation-induced mass transfer in 2-dimensional environments.
3.2.1 Frequency variation
In the 2-dimensional environment, geometry A was first tested across a range of frequencies from 2 Hz to 6 Hz. This is shown in Supplementary Video S2. Each frequency (2.0, 2.5, 3.0, 4.0, 4.7, and 6.3 Hz) is active for 8–10 s. During the first oscillation frequencies (2-4.7 Hz), the flow is mostly reversible, with the dye following the same trajectory in both strokes. There is an overall migration of dye from left to right, which is likely mostly due to shear dispersion caused by the uneven velocity profiles in the channels, and dead zone dispersion. As the highest frequency is activated however, the flow patterns change, and non-reversible eddies and irregularities emerge, which contribute to a much faster mixing of the dye.
3.2.2 Geometry variation
The three different geometries (A, B, and C) were tested at a steady, 6.3 Hz oscillation, at two different amplitudes. Supplementary Video S3 shows geometry A with a low amplitude oscillation. Here can be seen how some large-scale convection arises in the form of plumes and eddies, particularly at the orifices of the channels. These convection patterns contribute to a more rapid mixing of the dye, but the effect is minor. In Supplementary Video S4 the same geometry is exposed to high amplitude oscillations. The flow patterns here are much more pronounced, contributing to the rapid mixing of the dye in the channels and in a zone which extends 20-50 mm from the channel orifices. The flow here appears turbulent, and the convection features are at a scale much larger than the oscillation amplitude.
Supplementary Videos S5 and S6 show instead geometry B, which is the straight channels with no reticulation, at low and high amplitude oscillations respectively. The flow at low amplitude here is almost completely reversible, showing very little displacement of the dye. At high amplitude, some shear dispersion appears to take place, causing a slow migration of the dye, but no eddies or other large scale features or turbulence appears. Supplementary Video S7 shows the large amplitude oscillations in this geometry after more than a minute has passed. At this time the dye has migrated to the right chamber, but no turbulence or eddies are visible, and the flow is mostly reversible.
Supplementary Video S8 shows the wider reticulated geometry C at high amplitude oscillations. This video shows very similar flow patterns to Supplementary Video S4, with large-scale non-reversible flow or turbulence contributing to the rapid mixing of the dye.
Finally, Supplementary Video S9 shows geometry C with very high amplitude and low frequency oscillations. In this video it is possible to observe the influence of the geometric obstacles on the flow in the channels, and it shows how eddies and other irregularities form which lead to dye mixing. It is however not evident if this flow pattern is identical to the other oscillations which are of significantly lower amplitude and higher frequency.
3.2.3 Visualization of turbulent flow in reticulum
Figure 9 shows five sequential still images taken 0, 2, 5, 10 and 30 s after oscillations start. The images are taken from the experiment using geometry C (wide reticulum) and high amplitude oscillations, as these conditions best visualize the flow while being similar in kind to the flows at low amplitude and in geometry A.

FIGURE 9. Image series showing flow patterns in geometry C, high amplitude oscillations.
From these images can be seen that the region where mixing occurs rapidly extends away from the reticulum and engages the zone where dye is present, at a distance of 20 mm from the channel openings and beyond. Between 2 and 5 s the dye enters the reticulum, and at 10 s the dye has penetrated most of the left half of the reticulum. Significant mixing in the left chamber has occurred at 10 s. At 30 s the full left chamber contains dye and the concentration gradients are relatively smooth. The mixing zone can be concluded to extend at least 50 mm away from the channel openings.
The gradients in the reticulum are very smooth, demonstrating a high level of internal mixing, more so than what is found in the chambers.
Figure 10 shows close-up images of the flow at t = 5 s and t = 10 s. These images demonstrate the smooth concentration gradients throughout the reticulum, and in particular demonstrate the absence of a laminar boundary layer near the solid boundaries or at flow intersections.
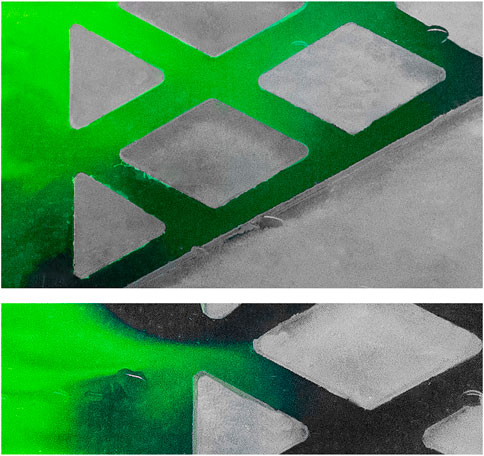
FIGURE 10. Images show close-up views of flows at 12 s and 5 s (geometry C, high amplitude). Note the smooth cross-sectional profile of dye concentration, showing the absence of boundary layer.) (Images have been digitally cleaned to enhance legibility.).
4 Discussion
The results demonstrate that the reticulated tunnel structures found in the mound egress complex interact with a transient flow in ways that create significantly increased mass transfer rate. The regular, oscillating flow induced in these experiments may be analogous to the turbulent wind conditions experienced around the termite mounds, and provide some evidence that transient flows may be involved as a component of the termite colony respiration as suggested by (Turner, 2001). However, it is the potential use of these structures as semi-active regulators of building climates that is of greatest interest in this investigation.
The reticulated network can potentially be replicated in additively fabricated building envelopes where the narrow diameter and tortuous nature of the channels would strongly limit the pressure-driven continuous flow (the laminar flow rate through a pipe is proportional to the fourth power of the pipe radius according to Poiseuille’s law). If an elevated mass transfer rate can be induced by electronically controlled oscillators interacting with a static geometry incorporated into the building envelope itself, it can allow for selective and situation-dependent transfer of heat and moisture across and within the envelope.
We have found that transient mass transfer in the investigated geometry occurs across a range of frequencies and amplitudes. Within this threshold, peak mass transfer occurs around 30-40 Hz, and at the amplitudes tested there is significant increase of the mass transfer rates over natural diffusion within the range of 10-100 Hz.
Visual observation during the first set of experiments suggest that the oscillations cause significant turbulence in direct proximity to the egress complex; this turbulence appears to be correlated to the observed increase in mass transfer rates. This suggestion is supported through the visual observation in the 2-dimensional experiment.
The 2-dimensional setup allowed us to visualize clearly what occurs within the network as the oscillations propagate through the system and to evaluate the interaction of edge length in the network with amplitude and frequency. The relative equivalence of the two systems, water and air, was shown theoretically through the calculation of Reynolds and Womersley numbers, and the results of the experiments supported this equivalence. As we see in the videos and still images eddies, jets and other turbulent features form within the reticulated tunnels and their orifices almost immediately when the oscillations begin. We also see that these turbulent features lead to the rapid transfer of the dye from the source chamber to the reticulum and to the right chamber.
Within the water medium, diffusivity is several orders of magnitude smaller than in air (Cussler, 1997). Therefore, no significant diffusion-only transport occurs over distances greater than a few millimeters, and we are able to conclude that the turbulent features occur consistently across the whole range between the source and the right chamber.
4.1 Functional utility
The magnitude of the flow as recorded in the experiments reached approximately 0.05 L/s, across the 2.7 dm2 outer surface of the mound sample, or 1.8 L/s*m2. As air has a heat capacity of about 700 J per kg per °K and a mass of 1.2 kg per 1000L, this is the equivalent of 1.6W/°K for each square meter of wall area. Even with a diurnal temperature difference of 10-15 K, this is on the low side of what is needed for air conditioning. However, it is within the range where there is a potentially significant effect for heating or cooling. If combined with mechanisms for evaporative cooling, the achievable cooling effects can be significantly higher for the same net flow due to the much higher enthalpy of evaporation of water.
Furthermore, the equivalent air flow was shown to scale with a stronger than linear dependency to oscillation amplitude (the flow is proportional to the square of the amplitude in the reported experiments, but the data is too limited to qualify this with certainty). This indicated that achievable flows can potentially be increased with relative ease in a full-scale system.
4.1.1 Moisture transport
An alternative use of the resulting airflows is for moisture transport, where a smaller net flow can be useful. If combined with embedded sensors that track relative humidity (RH) within and outside of the wall, oscillation driven flow can be activated to selectively regulate the internal humidity and maintain desirable microclimates. The immediate applicability for this is to keep the inside of porous walls dry by activating the flow whenever the external RH is lower than the wall’s internal RH. However, we would also suggest that the function could be equally useful to maintain a minimum internal humidity within a porous living wall. Such a wall can potentially harbor a functional ecosystem of native species, and would not allow opportunist monocultures to establish themselves, thus reducing the risk of problematic molds and pathogens (but would require inorganic construction materials).
4.1.2 Boundary layer
The homogenous distribution of dye across the channel cross section shown in Figure 10 demonstrates the lack of a laminar boundary layer and indicates that particles suspended in the air would come in frequent contact with the walls of the channel network. This can potentially be utilized to filter out particles such as dust or pollen, or even break down air pollution through the use of catalyst surfaces.
The lack of an insulating boundary layer is important from the perspective of heat and moisture transport. This will facilitate the exchange of heat or moisture between the air and the wall material and provide an efficient mechanism for storage of heat and moisture within the solid materials of the wall.
4.1.3 Meristem wall
The Meristem Wall (Goidea, Popescu, and Andréen, 2021) is a project that has demonstrated the feasibility of incorporating a reticulated network of the kind that is discussed here into a building envelope. This full-scale prototype is fabricated using a sand binder jetting process, and integrates a reticulated network as well as a number of other functions and components within a single monolithic material. To negotiate the multiple considerations necessary to achieve a functional outcome, the wall is designed using an algorithmic and self-organizing process.
4.2 Emergence of turbulence
The turbulent features observed are significant in size and distribution: they are 1-2 orders of magnitude larger than the oscillation amplitudes and extend across the full reticulum. The turbulence appears only with certain geometries and with certain flows, and the cause is so far uncertain. It was shown that the flow characteristics change significantly as a certain frequency threshold is passed, with a resulting propagation of turbulent features which were not evident at lower frequencies. While shear dispersion appeared to be the main mixing mechanism below this threshold, larger scale flows dominated above the threshold. A similar, but less abrupt, effect was shown for amplitude variation, where greater amplitude promoted large scale irregularities in the flow.
Typically, the Reynolds number (Re) is used to determine if turbulence can be expected within a certain flow. This can be calculated for the two systems. In the case of the EC and the air oscillations, we can assume a hydraulic diameter of 4 mm for the smaller tunnels. At 40 Hz and an amplitude of 5 mm, the average velocity of the air is 0.2 m/s. These numbers yield a Reynolds number of approximately 50. The Re of the water oscillations is similar, at about 150. Peak velocity is greater for both systems, and there may be other factors, but in either case these numbers are not sufficiently high to lead to outright turbulence (but likely high enough to ensure that the flow is not fully reversible.) This prediction of laminar flow is accurate in the case of the straight connections (geometry B) in the 2D experiment, where no or negligible turbulent flow was observed in the channels, but not in the case of the EC or the reticulated 2D geometry even though the Re is similar.
It may be that local shear forces increase significantly around the edges and bifurcations of the geometry, as is documented in the case of pendelluft phenomena in the human bronchial tree (Safonoff and Emmanuel, 1967; Nagels and Cater, 2009), and this may account for the turbulence in the reticulated geometries. Other potential drivers of the observed turbulent features include the formation of synthetic jets (Smith and Glezer, 1998) at asymmetric orifices, though it is uncertain whether the asymmetry within the reticulated network is sufficient to induce such phenomena in other places than the outer openings. This suggestion is supported by the apparent formation of a jet with a vortex street around one of the orifices of the EC in the first set of experiments, as shown in Supplementary Video S1 and Figure 7.
It should be noted that chaotic flows, even if not fully turbulent, result in mixing through the diverging pathways of proximate particles within the turbulent region, i.e., chaotic mixing (Ottino, 1990). These mixing phenomena are typically described at micro scale, though they are effective at larger scales as well (Wiggins and Ottino, 2004).
4.2.1 Biological equivalence
(Reidenbach et al., 2012) has documented the influence of coral morphology and flow environment on mass transfer rates in coral reefs. In unidirectional flow the mass transfer rates decreased with a tighter spacing of the branches, but in oscillating flow the opposite was true, and mass transfer was found to increase with a tighter branch spacing as well as increased frequency of the oscillations. These findings are in line with what we have documented in this paper, and suggest that transient mass transfer mechanisms which are dependent on geometric features are not uncommon in nature.
In previously established models for termite mound mass transfer (which typically concern respiratory gases) (Lüscher, 1961; Korb, 2003), the assumed mechanisms have depended on continuous flow, either through natural (buoyancy driven) or forced (wind driven) convection. Turner has pointed to data that contradict the dominance of such flows in the mounds of M. michaelseni and suggested an alternative hypothesis where transient flows drive mass transfer (Turner, 2001). Here we have found conclusive evidence for such mechanisms: at a range of frequencies a low amplitude oscillation of the air in and around the mound can drive mass transfer at rates significantly greater than a purely diffusive system, even though the oscillation amplitude is significantly smaller than the barriers they penetrate, and the net bulk flow is 0. Further research may determine whether these mechanisms are an active and major part of the termite mound physiology, and if so what this role may be. One possibility is that they are part of the exchange of respiratory gases between the mound and the surrounding environment, or they may be involved in the mound construction phase where it could influence the spread and distribution of moisture, which is a critical component in the termite construction work, both as a resource [see, for example, (French and Ahmed, 2010)] and as a stigmergic marker.
5 Conclusion
We have described the nature of transient mass transfer across the reticulated tunnel geometry–egress complex–typically found in the spires of M. michealseni mounds that can be generated by a forced oscillation of the air volume across the tunnel network. The occurrence of such mass transfer mechanisms has been speculated in literature but has not previously been demonstrated experimentally. In the experimental set-up used here, and with the specific geometry of the tested EC sample, the effect was strongest in frequencies around 20-40 Hz. The effects were strong at amplitudes of about 5 mm within the channels, which is significantly smaller than the smallest edge length of the reticulum network, and increasing amplitude caused significantly higher mass transfer rates.
The primary cause of the increased mass transfer is the formation of turbulent or near-turbulent flows within and in direct proximity of the EC tunnels. These turbulent features appear at velocities which are lower than would be expected from a Reynolds number analysis, and only arise in these conditions when the tunnel network is interconnected or reticulated. These transient flows are not, as would be expected from a steady flow, impeded by the high tortuosity of the channels, but appear to be dependent on such geometric complexity. The findings do not fit simply within conventional steady-state studies and may become clearer as the mathematics and behavior of transient systems become more developed. We hope that our results can inspire a more thorough study of the interaction of geometric form and transient flows.
Because of the turbulent nature of the flow, the laminar boundary layer near the tunnel walls is reduced or eliminated. This lack of boundary layer promotes a significant exchange between the fluid flow and the solids of the EC. In combination with the ability to penetrate high tortuosity geometries with a high surface area, this suggests that the described mechanisms can be effectively utilised to transfer mass or energy into and out of solid structures which could be of significant benefit in a wide range of engineering applications. In a building envelope this can enable the regulation of the building’s interior climate, e.g., through asymmetric thermal buffering or evaporative cooling, as well as the regulation of the internal microclimate of the envelope itself, e.g., to reduce microbial growth and resulting decay of organic matter or to promote conditions that can sustain a functional ecosystem.
Such mechanisms depend on the possibility to design and fabricate complex, reticulated geometries within the building envelope, and to embed mechanisms for sensing and actuation. The performative behavior of the system would depend on its functionally graded form, its interaction with the surrounding environment, and the way oscillations are selectively applied. This requires the ability to create variable, high-resolution structures that adapt to the particular context they are found in. Such structures are particularly suitable for additive fabrication methods. The necessary resolution and volume of such structures suggests that powder-based printing methods may be most suitable. Furthermore, an algorithmic design process is likely necessary to manage the interdependence and complexity inherent to the proposed system.
Data availability statement
The original contributions presented in the study are included in the article/Supplementary Material, further inquiries can be directed to the corresponding author.
Author contributions
The authors confirm contribution to the paper as follows: study conception and design: DA, RS; data collection: DA, RS; analysis and interpretation of results: DA; draft manuscript preparation: DA All authors reviewed the results and approved the final version of the manuscript.
Funding
DA was funded for the experimental work through ERSRC grant EP/G037159/1 (Industrial Doctorate Centre: Virtual Environments, Imaging and Visualisation), and for the writing and publication through Swedish research council Formas grant 2020-02152 (Biomimetic fabrication through robotic 3d printing). RS was funded through Human Frontier Science Program (HFSP) grant RGP0066/2012 (From swarm intelligence to living buildings. Novel concepts of managing internal climates).
Acknowledgments
The results presented here have originally been documented in the Eng.D. thesis “Discriminatory transient mass transfer through reticulated network geometries: a mechanism for integrating functionalities in the building envelope” presented at UCL (University College London) (David Andréen 2016).
Conflict of interest
The authors declare that the research was conducted in the absence of any commercial or financial relationships that could be construed as a potential conflict of interest.
Publisher’s note
All claims expressed in this article are solely those of the authors and do not necessarily represent those of their affiliated organizations, or those of the publisher, the editors and the reviewers. Any product that may be evaluated in this article, or claim that may be made by its manufacturer, is not guaranteed or endorsed by the publisher.
Supplementary material
The Supplementary Material for this article can be found online at: https://www.frontiersin.org/articles/10.3389/fmats.2023.1126974/full#supplementary-material
References
Andréen, D., and Goidea, A. (2022). Principles of biological design as a model for biodesign and biofabrication in architecture.” Archit. Struct. Constr. 1, 481–491. doi:10.1007/S44150-022-00049-6
Cussler, E. L. (1997). Diffusion: Mass transfer in fluid systems 2nd ed. Cambridge, United Kingdom: Cambridge University Press. Available at: http://books.google.com/books?hl=sv&lr=&id=dq6LdJyN8ScC&pgis=1.
Darlington, J. P. E. C., Zimmerman, P. R., Greenberg, J., Westberg, C., and Bakwin, P. (1997). Production of metabolic gases by nests of the termite macrotermes jeanneli in Kenya. J. Trop. Ecol. 13 (04), 491–510. doi:10.1017/s0266467400010671
David Andréen (2016). Discriminatory transient mass transfer through reticulated network geometries: A mechanism for integrating functionalities in the building envelope. UCL University College London. [doctorate thesis].
French, J. R. J., and Ahmed, B. M. (2010). The challenge of biomimetic design for carbon-neutral buildings using termite engineering. Insect Sci. 17 (2), 154–162. doi:10.1111/j.1744-7917.2009.01306.x
Goidea, A., Floudas, D., and Andréen, D. (2022). Transcalar design: An approach to biodesign in the built environment. Infrastructures 7 (4), 50. doi:10.3390/INFRASTRUCTURES7040050
Goidea, A., Popescu, M., and Andréen, D. (2021). “Meristem wall- an exploration of 3D-printed architecture,” in Realignments: Toward critical computation proceedings of the 41st annual confeernce of the association for computer aided design in architecture. Editors B. F. Kathrin Dörfler, S. Parascho, J. Scott, and B. Bogosian (ACADIA), 438–443.
Heyde, A., Guo, L., Jost, C., Guy, T., and Mahadevan, L. (2021). Self-organized biotectonics of termite nests. Proc. Natl. Acad. Sci. U. S. A. 118 (5), e2006985118. doi:10.1073/PNAS.2006985118/SUPPL_FILE/PNAS.2006985118.SM02.MP4
Korb, J. (2003). Thermoregulation and ventilation of termite mounds. Die Naturwiss. 90 (5), 212–219. doi:10.1007/s00114-002-0401-4
Loudon, C., and Tordesillas, A. (1998). The use of the dimensionless Womersley number to characterize the unsteady nature of internal flow. J. Theor. Biol. 191 (1), 63–78. doi:10.1006/jtbi.1997.0564
Lüscher, M. (1961). Air-conditioned termite nests. Sci. Am. 205, 138–145. doi:10.1038/scientificamerican0761-138
Nagels, A. M., and Cater, J. E. (2009). Large eddy simulation of high frequency oscillating flow in an asymmetric branching airway model. Med. Eng. Phys. 31 (9), 1148–1153. doi:10.1016/j.medengphy.2009.07.013
Ottino, J. M. (1990). Mixing, chaotic advection, and turbulence. Annu. Rev. Fluid Mech. 22 (1), 207–254. doi:10.1146/annurev.fl.22.010190.001231
Reidenbach, M. A., Koseff, J. R., Monismith, S. G., Jonah, V., JonahSteinbuck, V., Koseff, R., et al. (2012). The effects of waves and morphology on mass transfer within branched reef corals. Limnol. Oceanogr. 51 (2), 1134–1141. doi:10.4319/lo.2006.51.2.1134
Ruelle, J. E. (1964). “L’architecture Du Nid de Macrotermes Natalensis et Son Sens Fonctionnel,” in Etudes sur les termites africains. Editor A. Bouillon (Paris: Maisson et Cie), 327–362.
Safonoff, I., and Emmanuel, G. E. (1967). The effect of pendelluft and dead space on nitrogen clearance: Mathematical and experimental models and their application to the study of the distribution of ventilation. J. Clin. Investigation 46 (10), 1683–1693. doi:10.1172/JCI105659
Sherman, M. H. (1990). Tracer-gas techniques for measuring ventilation in a single zone. Build. Environ. 25 (4), 365–374. doi:10.1016/0360-1323(90)90010-O
Smith, B. L., and Glezer., A. (1998). The Formation and evolution of synthetic jets. Phys. Fluids 10 (9), 2281–2297. doi:10.1063/1.869828
Soar, R. C., and Andréen, D. (2012). The role of additive manufacturing and physiomimetic computational design for digital construction. Archit. Des. 82 (2), 126–135. doi:10.1002/ad.1389
Turner, J. S. (2000a). Architecture and morphogenesis in the mound of macrotermes michaelseni (Sjöstedt)(Isoptera: Termitidae, Macrotermitinae) in northern Namibia. Cimbebasia 16, 143–175. Available at: http://www.esf.edu/efb/turner/publication pdfs/Cimbebasia 16_00.pdf.
Turner, J. S. (2005). Extended physiology of an insect-built structure. Am. Entomologist 51 (1), 36–38. doi:10.1093/ae/51.1.36
Turner, J. S. (2001). On the mound of macrotermes michaelseni as an organ of respiratory gas exchange. Physiological Biochem. Zoology PBZ 74 (6), 798–822. doi:10.1086/323990
Turner, J. S., and Soar, R. C. (2008). “Beyond biomimicry: What termites can tell us about realizing the living building,” in First international conference on industrialized (Intelligent Construction). (I3CON).
Turner, J. S. (2000b). The extended organism: The physiology of animal-built structures. Cambridge, Massachusetts: Harvard University Press.
Walker, D. A. (1987). A fluorescence technique for measurement of concentration in mixing liquids. J. Phys. E Sci. Instrum. 20 (2), 217–224. doi:10.1088/0022-3735/20/2/019
Keywords: metamaterials, building envelope, transient flow, additive fabrication, functional integration, functionally graded materials (FGM), physiomimetics, bio-inspiration
Citation: Andréen D and Soar R (2023) Termite-inspired metamaterials for flow-active building envelopes. Front. Mater. 10:1126974. doi: 10.3389/fmats.2023.1126974
Received: 18 December 2022; Accepted: 07 April 2023;
Published: 26 May 2023.
Edited by:
Anna Sandak, InnoRenew CoE, SloveniaCopyright © 2023 Andréen and Soar. This is an open-access article distributed under the terms of the Creative Commons Attribution License (CC BY). The use, distribution or reproduction in other forums is permitted, provided the original author(s) and the copyright owner(s) are credited and that the original publication in this journal is cited, in accordance with accepted academic practice. No use, distribution or reproduction is permitted which does not comply with these terms.
*Correspondence: David Andréen, david.andreen@abm.lth.se