Survey Methods and Demographics
The 2019 Military Family Support Programming Survey was fielded online from October 7, 2019 to November 11, 2019. During that time, 7,785 people participated.
BrancHes of service and service status:

Our participants come from every branch of service and are connected to military life in some way. More than 42 percent are active duty service members and their spouses. We also include veterans, retirees, national guard, and reserve members, and their families, as well as Gold Star spouses and divorced spouses.
Branches:
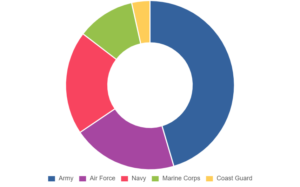
- Army: 45.4%
- Air Force: 20.1%
- Navy: 19.8%
- Marine Corps: 11.1%
- Coast Guard: 3.5%
Connection to Military Life:
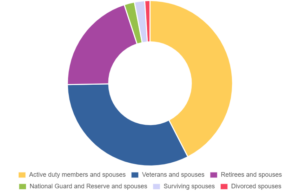
- Active duty members and spouses: 42%
- Veterans and spouses: 32%
- Retirees and spouses: 20%
- National Guard and Reserve and spouses: 2%
- Surviving spouses: 2%
- Divorced spouses: 1%
Ranks of service
Most survey respondents came from enlisted ranks, specifically E4 to E6, as is also true of today’s armed forces. We are proud that our respondents included all ranks of service.


- E1 to E3: 9.5%
- E4 to E6: 49.2%
- E7 to E9: 19%
- O1 to O3: 6.5%
- O4 to O6: 12.9%
- O7 to O9: 0.87%
- W1 to W3: 1.5%
- W4 to W5: 0.63%
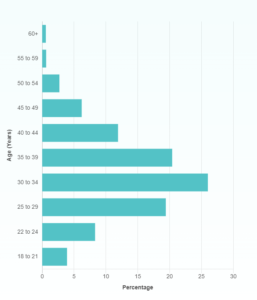
Ages

Most active duty service member respondents were younger than 34 years old, which is representative of the serving force, which, according to the Department of Defense 2018 Demographics Profile has an average age of 28.2. Similarly, the spouses of active duty service members who responded to our survey were also younger than 34 years old.
Active Duty Service Members:
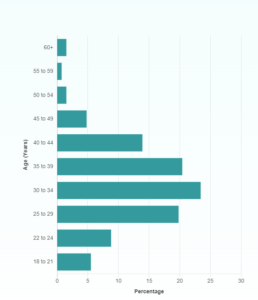
- 18 to 21: 5.5%
- 22 to 24: 8.8%
- 25 to 29: 19.8%
- 30 to 34: 23.4%
- 35 to 39: 20.4%
- 40 to 44: 13.9%
- 45 to 49: 4.8%
- 50 to 54: 1.5%
- 55 to 59: 0.73%
- 60+: 1.5%
Spouses of Active Duty Service Members:
- 18 to 21: 3.9%
- 22 to 24: 8.3%
- 25 to 29: 19.4%
- 30 to 34: 26%
- 35 to 39: 20.4%
- 40 to 44: 11.9%
- 45 to 49: 6.2%
- 50 to 54: 2.7%
- 55 to 59: 0.62%
- 60+: 0.57%
CHildren

The majority of active duty members and spouses who responded have children younger than 18. The childrens’ ages were relatively evenly distributed, with 68% of them younger than nine years old.
Families with children younger than 18:
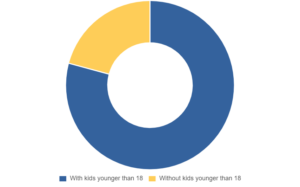
- With kids younger than 18: 79.9%
- Without kids younger than 18: 21%
Ages of children:
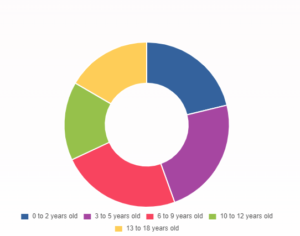
- 0 to 2 years old: 16.6%
- 3 to 5 years old: 23.3%
- 6 to 9 years old: 23.5%
- 10 to 12 years old: 15.4%
- 13 to 18 years old: 16.6%
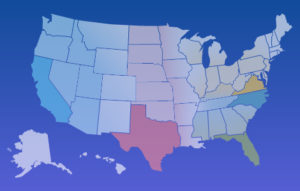
Locations
Respondents came from all 50 states in the country, two US territories, and 24 international countries. The top states in which the most respondents live are also the states most populated by service members: Texas, Virginia, California, North Carolina, and Florida.
All 50 States:
Respondents came from all 50 states in the country. The top states from which the most respondents live are also the states most populated by service members:
- Texas
- Virginia
- California
- North Carolina
- Florida
- New York
- Washington State
- Georgia
Two US territories
- Guam
- Puerto Rico
22 International Countries
- Bahrain
- Belgium
- Brazil
- China
- Colombia
- Cuba
- England
- Germany
- Greece
- France
- Italy
- Japan
- Kuwait
- Netherlands
- Philippines
- Poland
- Portugal
- Qatar
- Scotland
- South Korea
- Spain
- Thailand
Food Insecurity
In 2017, MFAN began exploring food insecurity in the military community. Explore our in-depth findings that shed light on the severity of food insecurity among military families.