
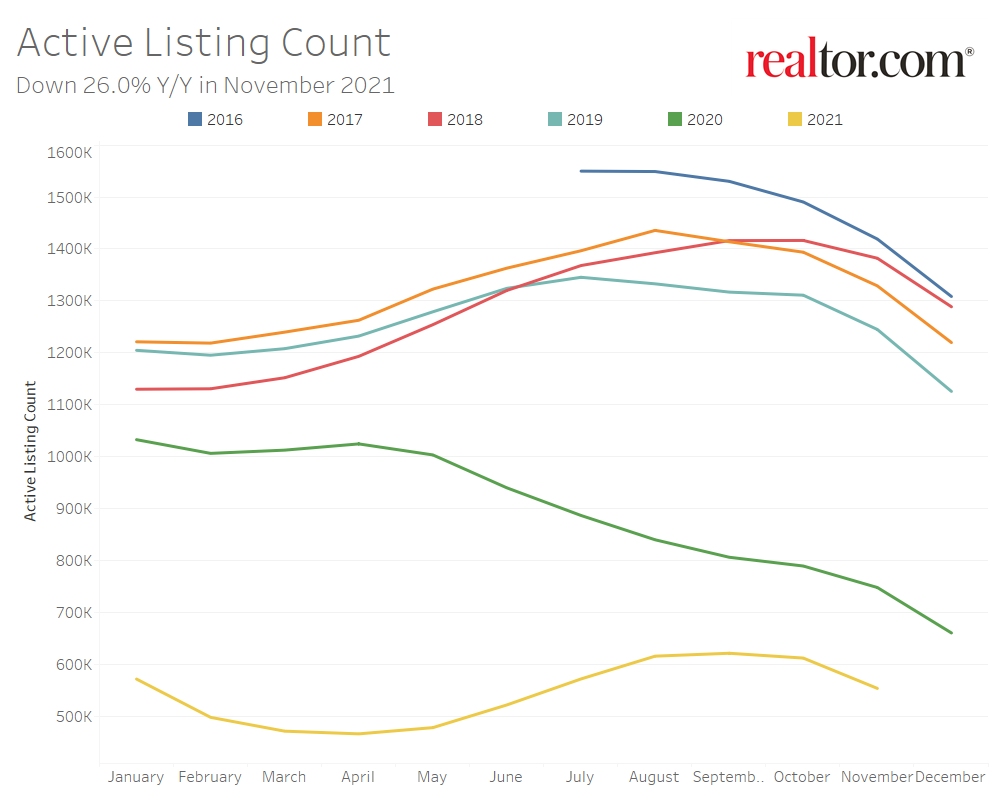
- The national inventory of active listings declined by 26.0% over last year, while the total inventory of unsold homes, including pending listings, declined by 16.2%. The inventory of active listings is down 55.5% compared to 2019.
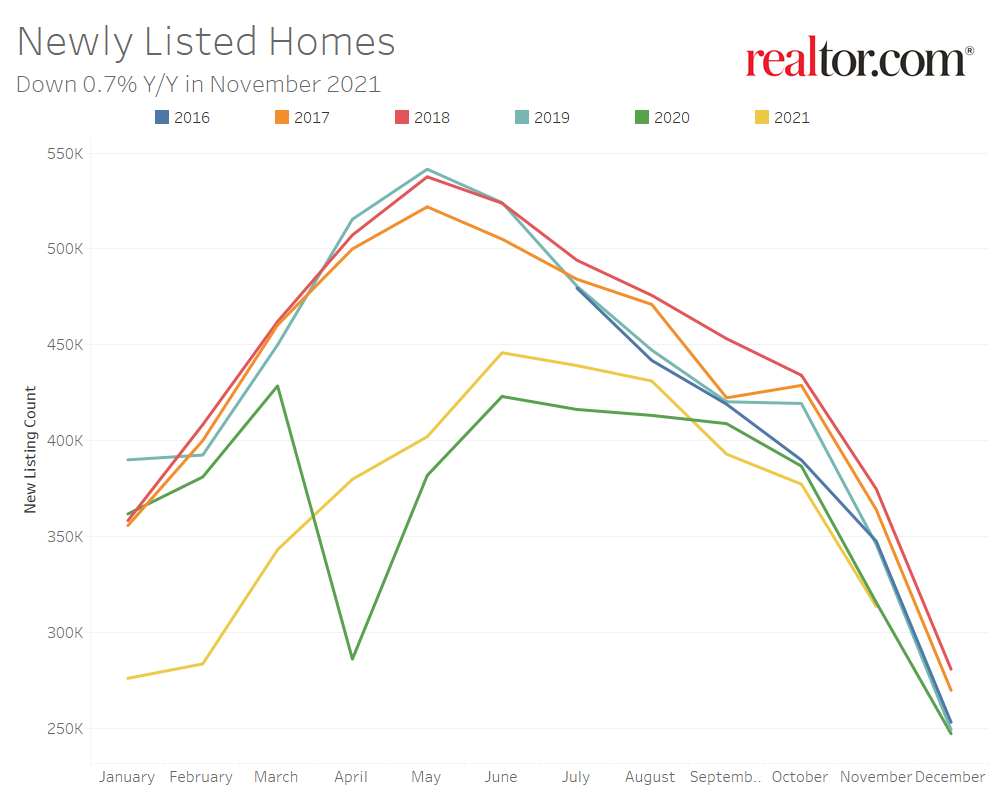
- Newly listed homes are down 0.7% nationally compared to a year ago, and down 0.2% for large metros over the past year. Sellers are still listing at rates 13.3% lower than typical 2017 to 2019 levels.
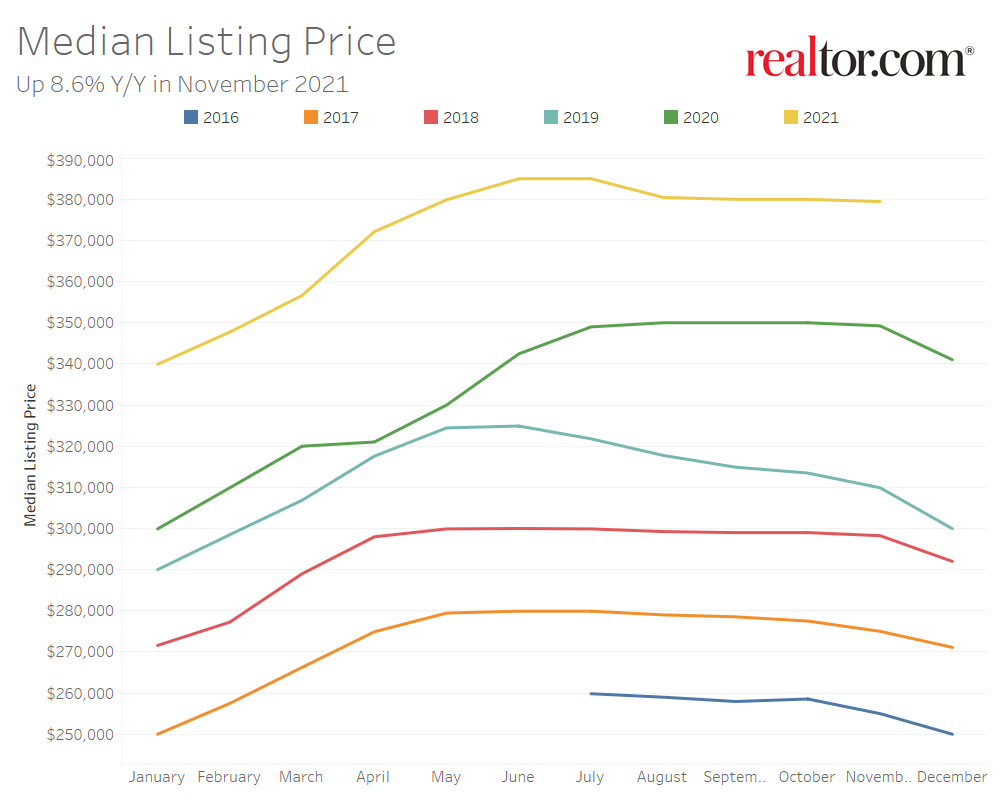
- The November national median listing price for active listings was $379,000, up 8.6% compared to last year and up 22.4% compared to 2019. In large metros, median listing prices grew by 4.5% compared to last year, on average.
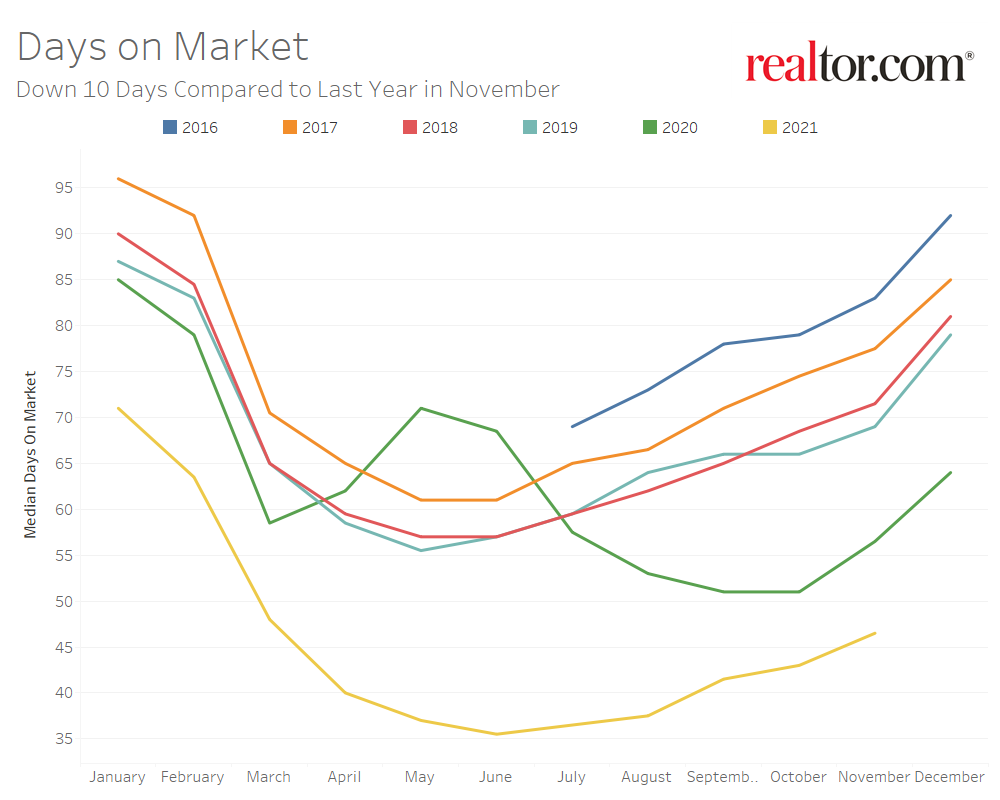
- Nationally, the typical home spent 47 days on the market in November, down 10 days from the same time last year and down 23 days from 2019.
Realtor.com®’s November housing data release reveals that the number of homes for sale continues to be limiting both buyers and sellers. This past month, the rate of decline in inventory increased, newly listed homes failed to materialize in sufficient numbers, and homes spent increasingly less time on the market compared to previous years. Currently 1 in 4 homeowners choosing not to sell are saying it’s because they can’t find a home in their price range. There is potential for improvement on the horizon, however. Listing price growth has remained stable for the past four months, more homeowners are planning to sell in the next 6 months, and single-family home construction continues at higher rates than recent history.
The Number of Homes for Sale Continues to Shrink
Nationally, the inventory of homes actively for sale in November decreased by 26.0% over the past year, a larger rate of decline compared to the 22.5% drop in October. Earlier this fall we saw consistent improvements in inventory as the rate of decline compared to last year shrank. In October and November, this progress stalled and then reversed as the rate of decline once again increased. This amounted to 194,000 fewer homes actively for sale on a typical day in November compared to the previous year. The total number of unsold homes nationwide—a metric that includes active listings and listings in various stages of the selling process that are not yet sold—is down 16.2% percent from November 2020.
In November, newly listed homes decreased by 0.7% on a year-over-year basis and sellers were still listing at rates 13.3% lower than typical of 2017 to 2019 levels. This marks the third straight month of lower new seller activity than last year which has contributed to lower inventory. However, the annual decline in new listings has improved over September and October when it was -3.9% and -2.4%, respectively.
The inventory of homes actively for sale in the 50 largest U.S. metros overall decreased by 24.2% over last year in November, an increase in the rate of decline compared to last month’s 21.1% decrease. Regionally, the inventory of homes in large western and southern metros are showing the largest year-over-year decline (-29.3% and -28.2%) followed by the Northeast (-22.0%) and Midwest (-13.7%). In the Midwest, where inventory conditions are relatively better, new listings have increased by 6.4% compared to last year.
Markets which are seeing the largest year-over-year growth in newly listed homes include Milwaukee (+17.4%), Charlotte (+16.1%) and Buffalo (+13.5%). Markets which are still seeing a decline in newly listed homes compared to last year include Hartford (-20.2%), San Francisco (-19.1%), and San Jose (-16.2%).
Homes Continue to Sell 10 Days Faster Than Last Year
The typical home spent 47 days on the market this November, which is 10 days less than last year and four days more than last month as the housing market slows down into the late fall and winter off-season. Despite typical seasonal slowing, homes still sold more quickly than any other November in recent history and homes even sold more quickly than during summer seasonal peaks of previous years.
In the 50 largest U.S. metros, the typical home spent 41 days on the market, and homes spent 6 days less on the market, on average, compared to last November. Among these 50 largest metros, the time a typical property spends on the market has decreased most in large metros in the South where the inventory crunch is most visible (-8 days), followed by the Northeast (-5 days), West (-4 days) and Midwest (-3 days).
Among larger metropolitan areas, homes saw the greatest yearly decline in time spent on market in Miami (-32 days), Raleigh (-24 days), and Orlando (-18 days). Five metros saw time on market increase: New Orleans (+7 days), San Jose (+5 days), Hartford (+4 days), Cincinnati (+1 day), and Kansas City (+1 day). However, time on market in all of these markets was still shorter than more typical levels seen in 2019.
Listing Price Growth Remains Consistent
The median national home price for active listings remained relatively the same from September through November, at $379,000. The median listing price grew by 8.6% over last year, almost the same annual rate of growth since August. Alternate price measures, which better account for a change in the mix of listings suggests that more smaller homes listed this year than last is dampening the rate of growth in the median listing price. The median listing price per square foot increased by 13.5% year-over-year in November. The median listing price for a typical 2,000 square-foot single family home rose 18.7% compared to last year.
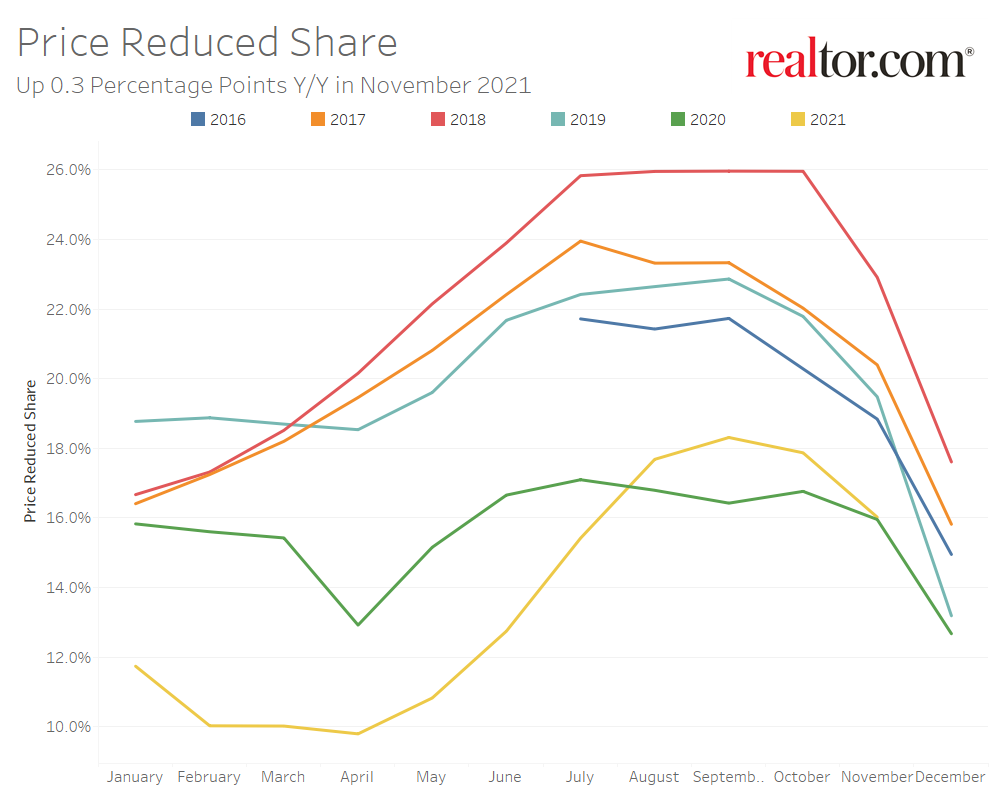
For the past four months, the share of homes which have had their price reduced has increased compared to the same time period last year. In November, the share of price reductions increased over last year by 0.3 percentage points. However, the share of price reductions is still 4.9 percentage points lower than typical 2017 to 2019 levels and the rate of increase compared to last year has been declining.
Active listing prices in the nation’s largest metros grew by an average of 4.5% compared to last year. Price growth in the nation’s largest metros has been lower than other areas across the country, but much of this can still be attributed to new inventory bringing relatively smaller homes to the market this year. The median listing price per square foot in the nation’s largest metros grew by 11.0% over the same period.
Austin (+31.7%), Las Vegas (+30.2%), and Tampa (+24.6%), posted the highest year-over-year median list price growth in November, while Austin (+4.5 percentage points), Hartford (+3.0 percentage points) and Baltimore (+2.8 percentage points) saw the greatest increase in their share of price reductions compared to last year.
November 2021 Regional Statistics (50 Largest Metro Combined Average)
| Region | Active Listing Count YoY | New Listing Count YoY | Median Listing Price YoY | Median Listing Price Per SF YoY | Median Days on Market Y-Y | Price Reduced Share Y-Y |
| Midwest | -13.7% | 6.4% | -4.3% | 6.7% | -3 days | -1.9% |
| Northeast | -22.0% | -3.6% | 0.4% | 7.7% | -5 days | 0.2% |
| South | -28.2% | -0.2% | 9.2% | 15.4% | -8 days | -1.2% |
| West | -29.3% | -4.4% | 7.8% | 9.7% | -4 days | -2.2%
|
November 2021 Housing Overview by Top 50 Largest Metros
| Metro | Median Listing Price | Median Listing Price YoY | Active Listing Count YoY | New Listing Count YoY | Median Days on Market | Median Days on Market Y-Y | Price Reduced Share | Price Reduced Share Y-Y |
| Atlanta-Sandy Springs-Roswell, Ga. | $394,000 | 9.5% | -23.4% | 8.8% | 38 | -8 | 14.9% | -1.6% |
| Austin-Round Rock, Texas | $550,000 | 31.7% | -6.9% | 12.8% | 37 | -12 | 19.2% | 4.5% |
| Baltimore-Columbia-Towson, Md. | $315,000 | -3.2% | -9.3% | -0.3% | 44 | -2 | 22.9% | 2.8% |
| Birmingham-Hoover, Ala. | $275,000 | 5.8% | -31.6% | -9.5% | 50 | -4 | 14.5% | 0.5% |
| Boston-Cambridge-Newton, Mass.-N.H. | $677,000 | 3.5% | -29.4% | -6.2% | 40 | -6 | 15.7% | -1.1% |
| Buffalo-Cheektowaga-Niagara Falls, N.Y. | $220,000 | 2.1% | -3.7% | 13.5% | 50 | -10 | 13.5% | -1.0% |
| Charlotte-Concord-Gastonia, N.C.-S.C. | $400,000 | 6.5% | -25.5% | 16.1% | 34 | -10 | 17.2% | 0.4% |
| Chicago-Naperville-Elgin, Ill.-Ind.-Wis. | $322,000 | -3.9% | -23.9% | -6.9% | 45 | -5 | 17.5% | -0.2% |
| Cincinnati, Ohio-Ky.-Ind. | $300,000 | 0.5% | -16.2% | 6.5% | 43 | 1 | 20.5% | -0.3% |
| Cleveland-Elyria, Ohio | $190,000 | -7.4% | -9.7% | 7.8% | 47 | -1 | 22.0% | -1.5% |
| Columbus, Ohio | $287,000 | -4.9% | -10.4% | 13.1% | 35 | -4 | 19.4% | -5.4% |
| Dallas-Fort Worth-Arlington, Texas | $400,000 | 11.4% | -33.9% | -0.1% | 39 | -11 | 14.0% | -5.9% |
| Denver-Aurora-Lakewood, Colo. | $622,000 | 19.1% | -31.7% | 0.4% | 33 | -10 | 17.0% | -3.0% |
| Detroit-Warren-Dearborn, Mich. | $231,000 | -11.2% | -6.2% | 9.4% | 36 | -6 | 20.5% | 2.3% |
| Hartford-West Hartford-East Hartford, Conn. | $340,000 | 13.7% | -61.6% | -20.2% | 48 | 4 | 14.6% | 3.0% |
| Houston-The Woodlands-Sugar Land, Texas | $362,000 | 6.4% | -22.6% | -3.1% | 47 | -3 | 17.8% | -0.5% |
| Indianapolis-Carmel-Anderson, Ind. | $270,000 | -1.2% | -28.7% | 4.0% | 41 | -6 | 21.5% | -6.2% |
| Jacksonville, Fla. | $375,000 | 17.4% | -33.4% | 8.8% | 43 | -9 | 18.1% | -1.6% |
| Kansas City, Mo.-Kan. | $332,000 | -2.3% | -10.0% | 0.9% | 49 | 1 | 16.3% | -2.8% |
| Las Vegas-Henderson-Paradise, Nev. | $448,000 | 30.2% | -32.8% | 5.3% | 35 | -8 | 14.6% | -2.2% |
| Los Angeles-Long Beach-Anaheim, Calif. | $899,000 | -9.8% | -37.5% | -15.8% | 40 | -3 | 11.2% | -0.9% |
| Louisville/Jefferson County, Ky.-Ind. | $249,000 | 1.9% | -7.0% | 0.9% | 34 | -3 | 21.7% | -2.1% |
| Memphis, Tenn.-Miss.-Ark. | $262,000 | -0.1% | -19.3% | -0.4% | 38 | -11 | 16.1% | -0.4% |
| Miami-Fort Lauderdale-West Palm Beach, Fla. | $487,000 | 17.3% | -51.3% | -13.8% | 59 | -32 | 10.7% | -2.3% |
| Milwaukee-Waukesha-West Allis, Wis. | $267,000 | -9.5% | -7.7% | 17.4% | 45 | -2 | 19.0% | -3.8% |
| Minneapolis-St. Paul-Bloomington, Minn.-Wis. | $350,000 | 1.5% | -9.0% | 4.8% | 42 | -1 | 16.8% | 0.7% |
| Nashville-Davidson–Murfreesboro–Franklin, Tenn. | $455,000 | 14.7% | -38.0% | -1.1% | 24 | -8 | 15.0% | -1.8% |
| New Orleans-Metairie, La. | $349,000 | 2.5% | -24.7% | -9.3% | 71 | 7 | 19.2% | -0.2% |
| New York-Newark-Jersey City, N.Y.-N.J.-Pa. | $655,000 | 0.9% | -17.4% | -6.8% | 57 | -6 | 11.2% | -1.5% |
| Oklahoma City, Okla. | $280,000 | 1.6% | -22.3% | -2.4% | 45 | -4 | 15.7% | -2.8% |
| Orlando-Kissimmee-Sanford, Fla. | $386,000 | 19.1% | -49.2% | -9.4% | 43 | -18 | 13.9% | -5.5% |
| Philadelphia-Camden-Wilmington, Pa.-N.J.-Del.-Md. | $312,000 | -8.0% | -6.4% | 8.7% | 51 | -1 | 20.0% | 0.0% |
| Phoenix-Mesa-Scottsdale, Ariz. | $485,000 | 16.1% | -14.7% | 0.2% | 35 | -3 | 19.6% | -2.3% |
| Pittsburgh, Pa. | $219,000 | -8.6% | -9.4% | 10.3% | 55 | -9 | 22.6% | -1.0% |
| Portland-Vancouver-Hillsboro, Ore.-Wash. | $551,000 | 3.5% | -19.1% | 7.1% | 42 | -7 | N/A | N/A |
| Providence-Warwick, R.I.-Mass. | $425,000 | 3.7% | -18.6% | -1.5% | 39 | -2 | 13.5% | 1.0% |
| Raleigh, N.C. | $425,000 | 10.4% | -48.1% | 2.0% | 23 | -24 | 13.2% | -1.2% |
| Richmond, Va. | $353,000 | -6.5% | -24.0% | 6.3% | 45 | -3 | 11.9% | -1.6% |
| Riverside-San Bernardino-Ontario, Calif. | $549,000 | 12.4% | -11.8% | -0.2% | 38 | -1 | 13.7% | 1.8% |
| Rochester, N.Y. | $200,000 | -12.9% | -30.2% | -11.6% | 26 | -9 | 11.6% | -0.6% |
| Sacramento–Roseville–Arden-Arcade, Calif. | $593,000 | 7.0% | -8.7% | -3.7% | 35 | -3 | 17.1% | 1.9% |
| San Antonio-New Braunfels, Texas | $347,000 | 15.2% | -27.0% | -0.3% | 45 | -3 | 17.3% | -1.5% |
| San Diego-Carlsbad, Calif. | $835,000 | 3.1% | -40.2% | -4.6% | 33 | -3 | 11.5% | -2.2% |
| San Francisco-Oakland-Hayward, Calif. | $984,000 | -6.2% | -35.6% | -19.1% | 38 | -3 | 10.2% | -3.5% |
| San Jose-Sunnyvale-Santa Clara, Calif. | $1,245,000 | 2.6% | -49.9% | -16.2% | 36 | 5 | 6.3% | -7.7% |
| Seattle-Tacoma-Bellevue, Wash. | $676,000 | 7.4% | -39.9% | -1.7% | 36 | -7 | 11.3% | -3.7% |
| St. Louis, Mo.-Ill. | $242,000 | -0.6% | -22.5% | 4.9% | 50 | -9 | 16.0% | -3.7% |
| Tampa-St. Petersburg-Clearwater, Fla. | $378,000 | 24.6% | -42.8% | -2.1% | 39 | -10 | 18.9% | -5.1% |
| Virginia Beach-Norfolk-Newport News, Va.-N.C. | $311,000 | -1.2% | -23.2% | -7.7% | 32 | -5 | 12.5% | 1.8% |
| Washington-Arlington-Alexandria, DC-Va.-Md.-W. Va. | $505,000 | 1.0% | -5.8% | -6.7% | 41 | 0 | 18.7% | 2.6% |
Note: With the release of its November 2021 housing trends report, Realtor.com® incorporated a new and improved methodology for capturing and reporting housing inventory trends and metrics. The new methodology uses the latest and most accurate data mapping of listing statuses to yield a cleaner and more consistent measurement of active listings at both the national and local level. The methodology has also been adjusted to better account for missing data in some fields including square footage. Most areas across the country will see minor changes with a smaller handful of areas seeing larger updates. As a result of these changes, the data released since December 2021 will not be directly comparable with previous data releases (files downloaded before December 2021) and Realtor.com® economics blog posts. However, future data releases, including historical data, will consistently apply the new methodology.
Subscribe to our mailing list to receive updates on the latest data and research.