
Social
This Fact Sheet details the direct contributions Canada’s energy sector made to federal and provincial revenues between 2000 and 2018, conservatively estimated at $359 billion.
That figure includes almost $240 billion in direct provincial revenues, almost $66 billion in direct federal revenues, and nearly $54 billion in indirect federal and provincial taxes. (The entire fact sheet can be viewed and downloaded here.)
$359 billion: As much as all Employment Insurance payments since 1996
To place the $359 billion in context, those energy revenues are:
- More than triple the forecast federal budget deficit of $112.7 billion for 2020/21;
- $36 billion more than the $322.9 billion in total federal program expenses in 2018/19;
- Nearly the same amount as the $366.2 billion in Employment Insurance benefits paid out between 1996 and 2019 in total.
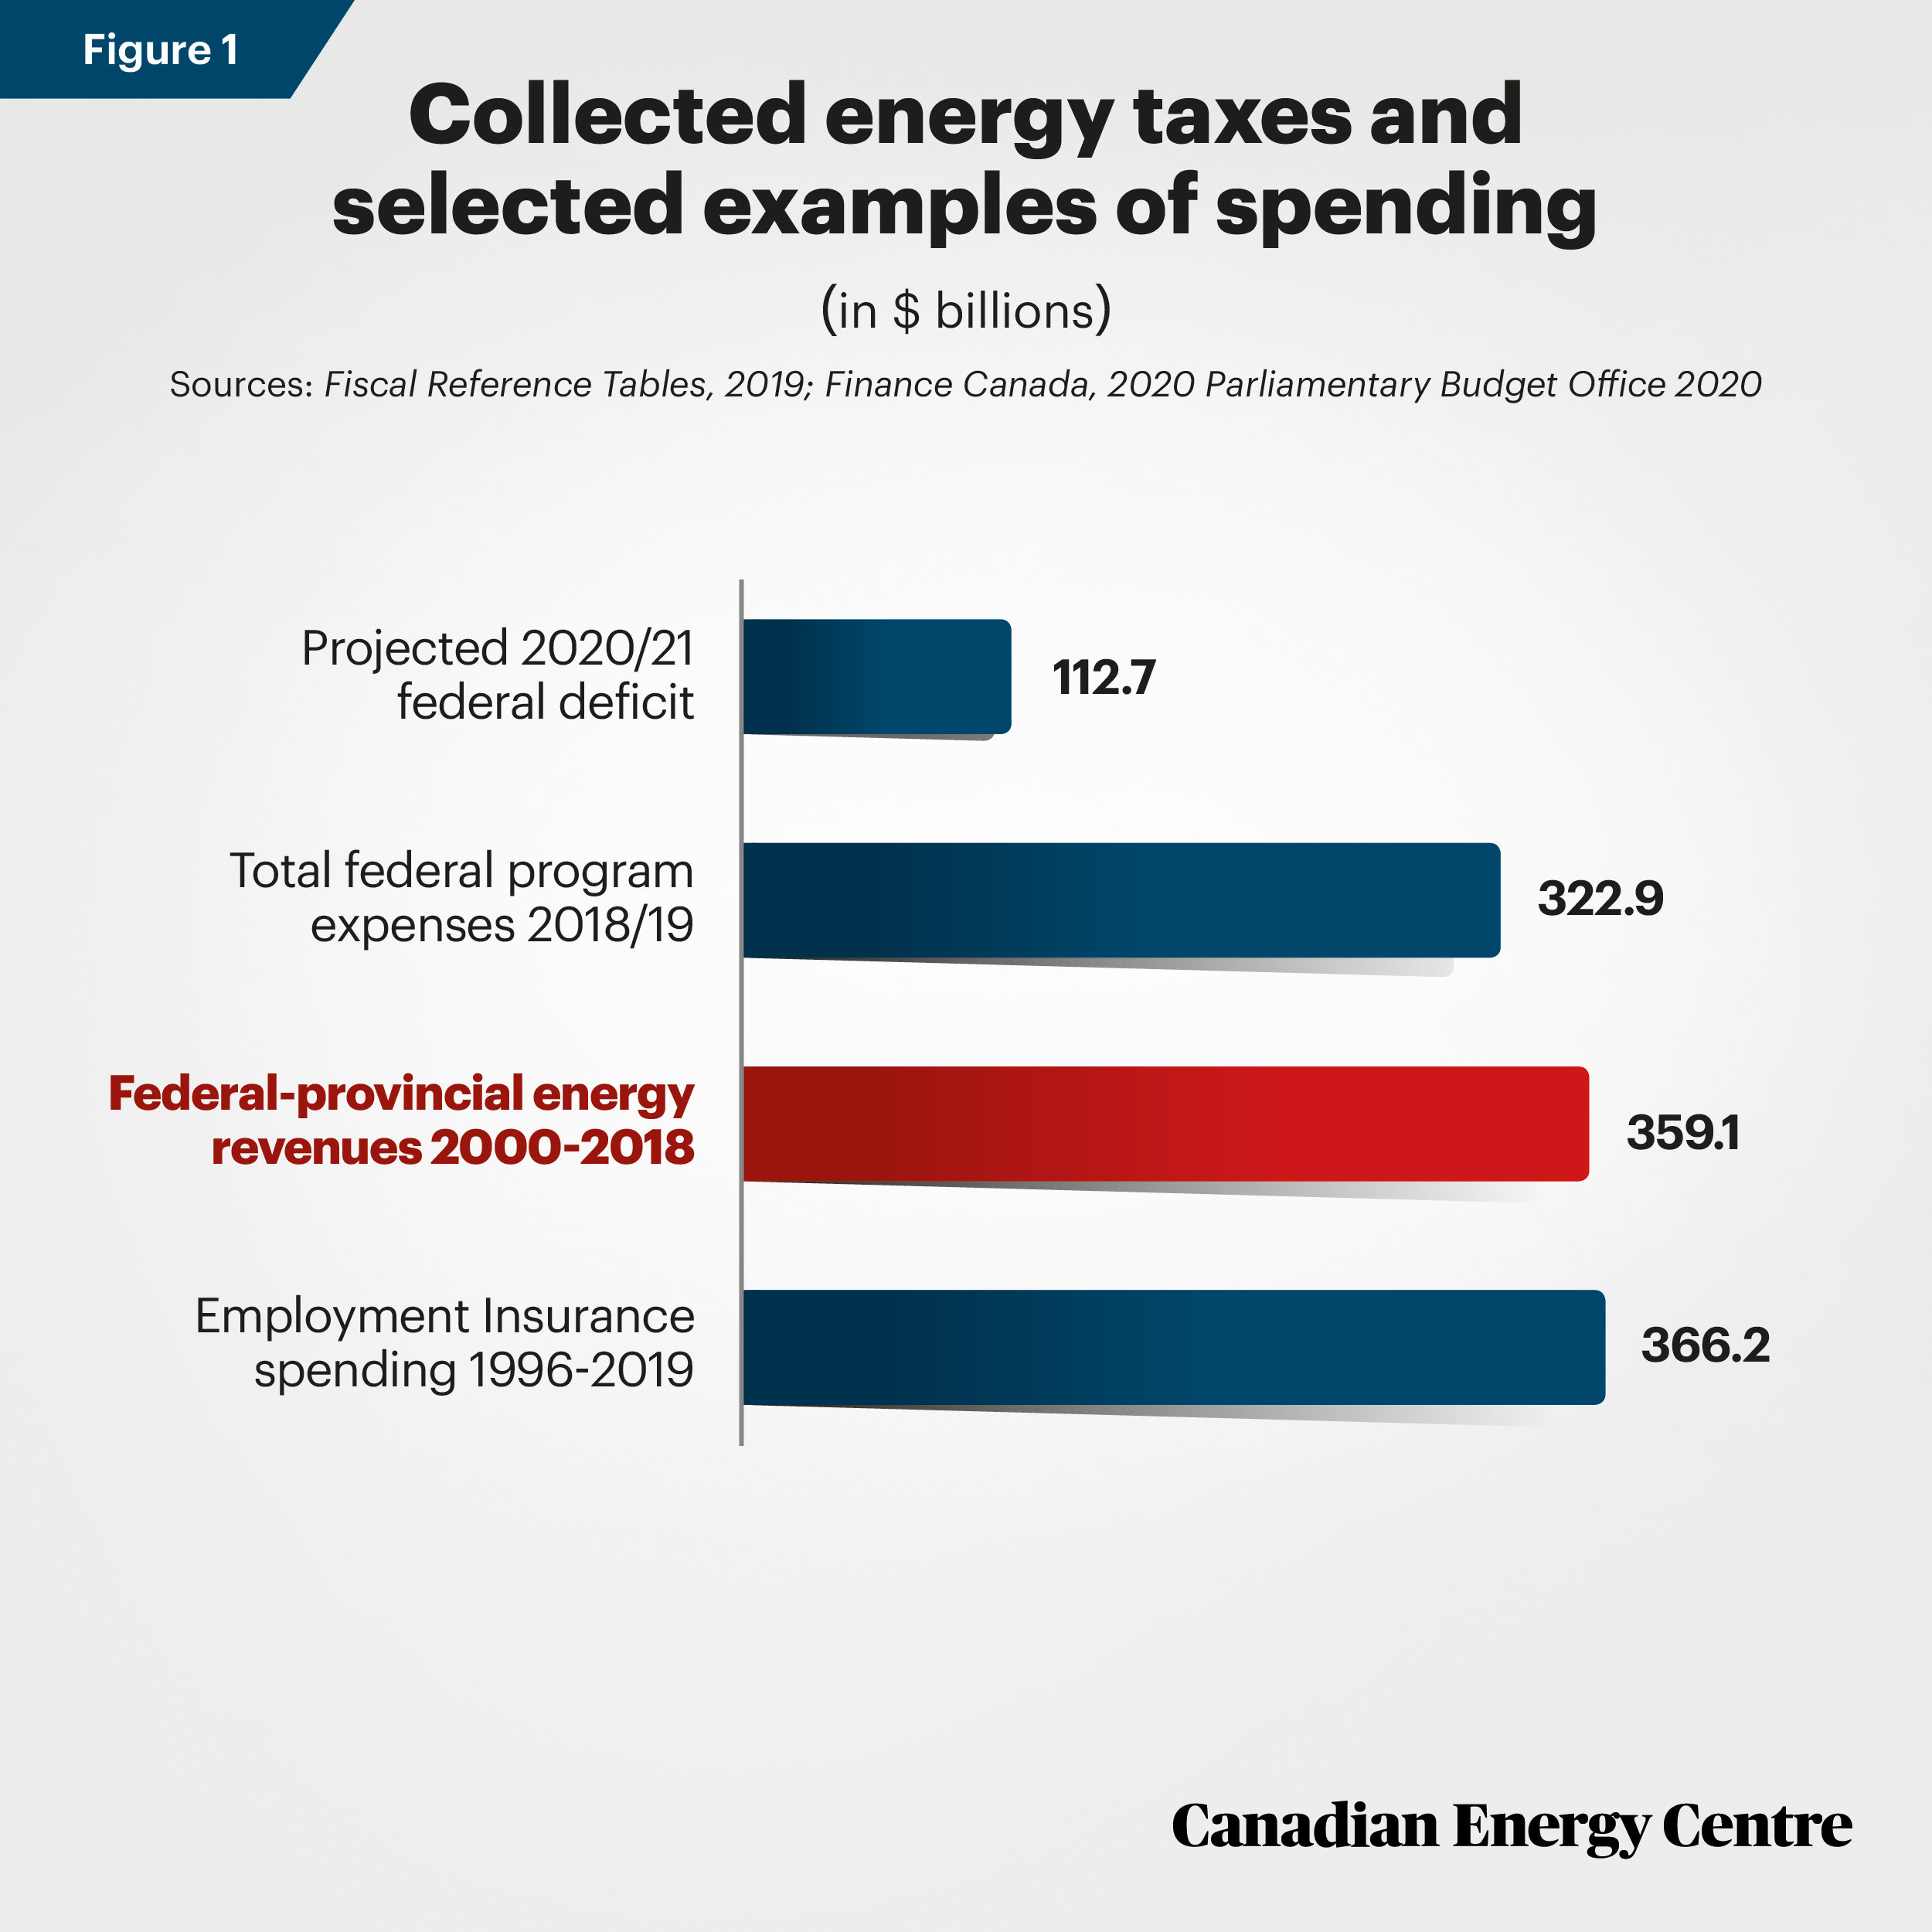
Sources: Fiscal Reference Tables, 2019; Finance Canada, 2020; Parliamentary Budget Office 2020.
The $359 billion estimate is low
The $359 billion figure is a conservative estimate of government energy revenues as it excludes:
- Personal income tax revenues paid to governments by hundreds of thousands of Canadians who work directly in the energy sector;
- Provincial rents and royalties paid between 2000 and 2007 (omitted due to a change in Statistics Canada reporting so the $166 billion in rents and royalties applies to the 2008-2020 period only);
- Property taxes and other taxes and fees paid to municipalities for pipelines, manufacturing facilities, office buildings, and other infrastructure;
- Taxes, fees, and revenues from benefit agreements paid to First Nations governments;
- Adjustments for inflation, even though the nominal total would be higher in 2020 dollars.
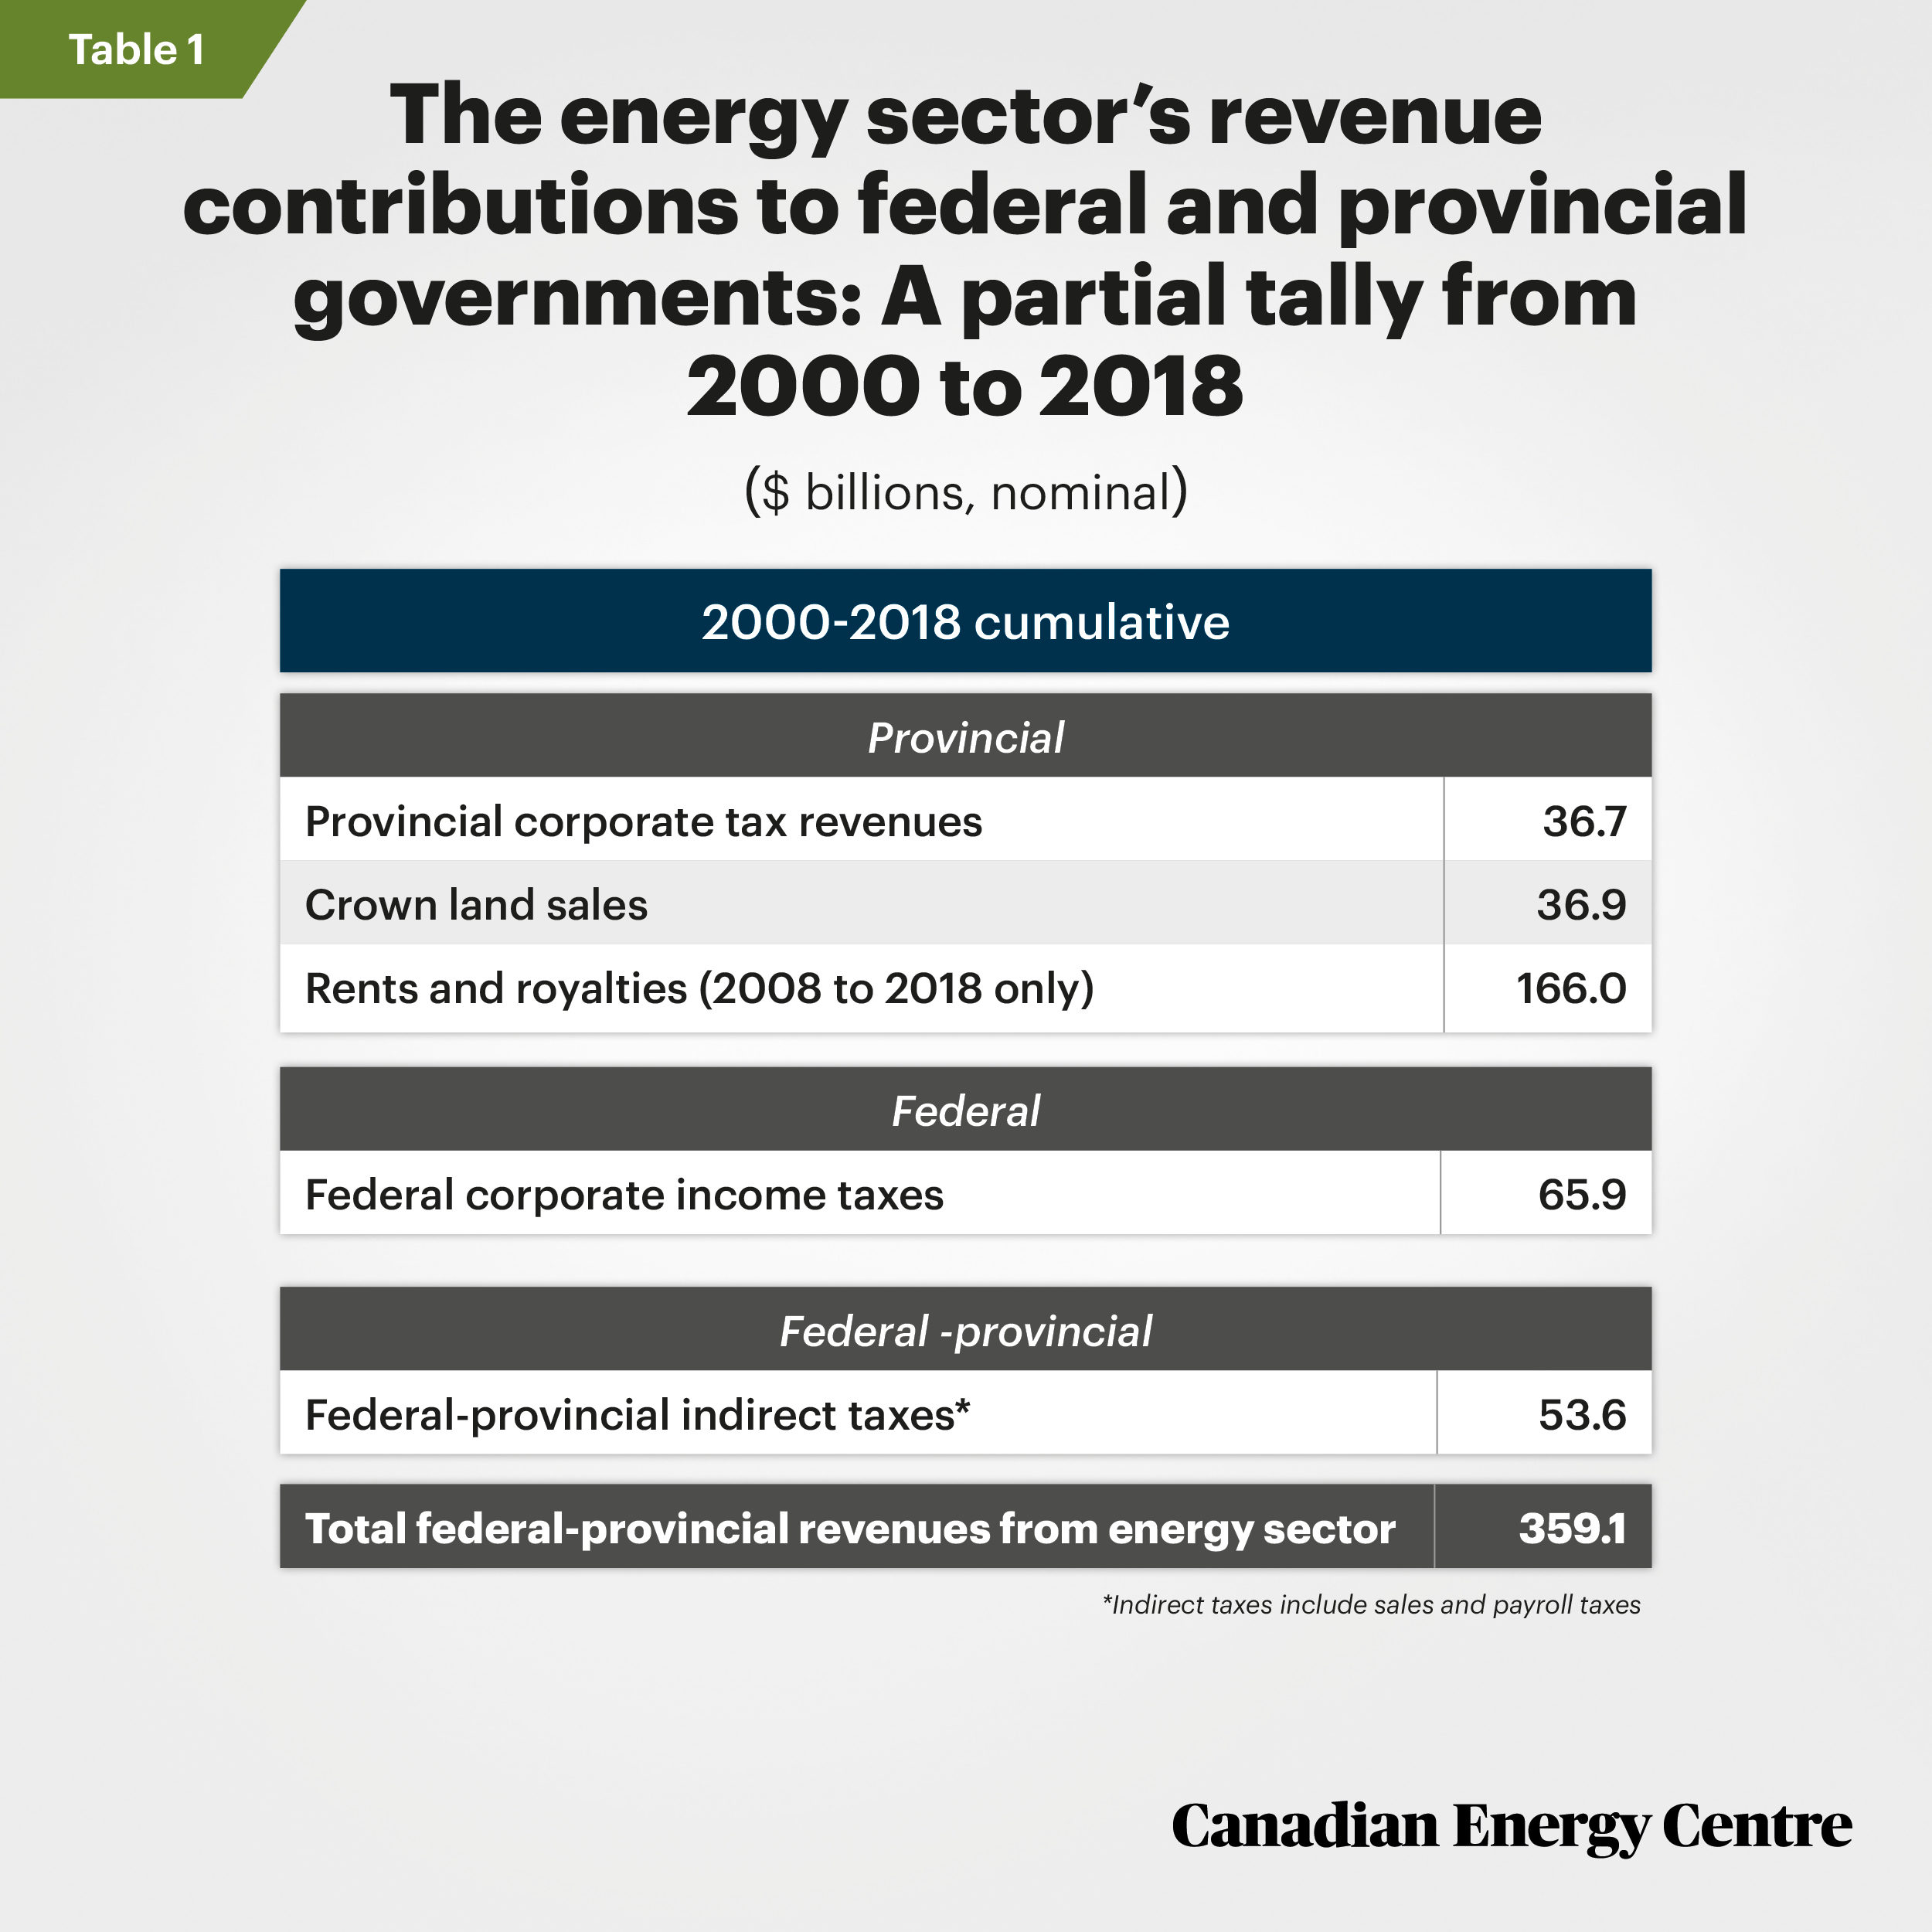
*Indirect taxes include sales and payroll taxes
Federal corporate incomes taxes: A comparison
Figures 2a and 2b show the federal corporate income taxes collected, by major sector, between 2000 and 2018. Other sectors such as real estate, banking, construction, and professional, scientific, and technical services all paid smaller proportions of such tax collections than Canada’s energy sector.
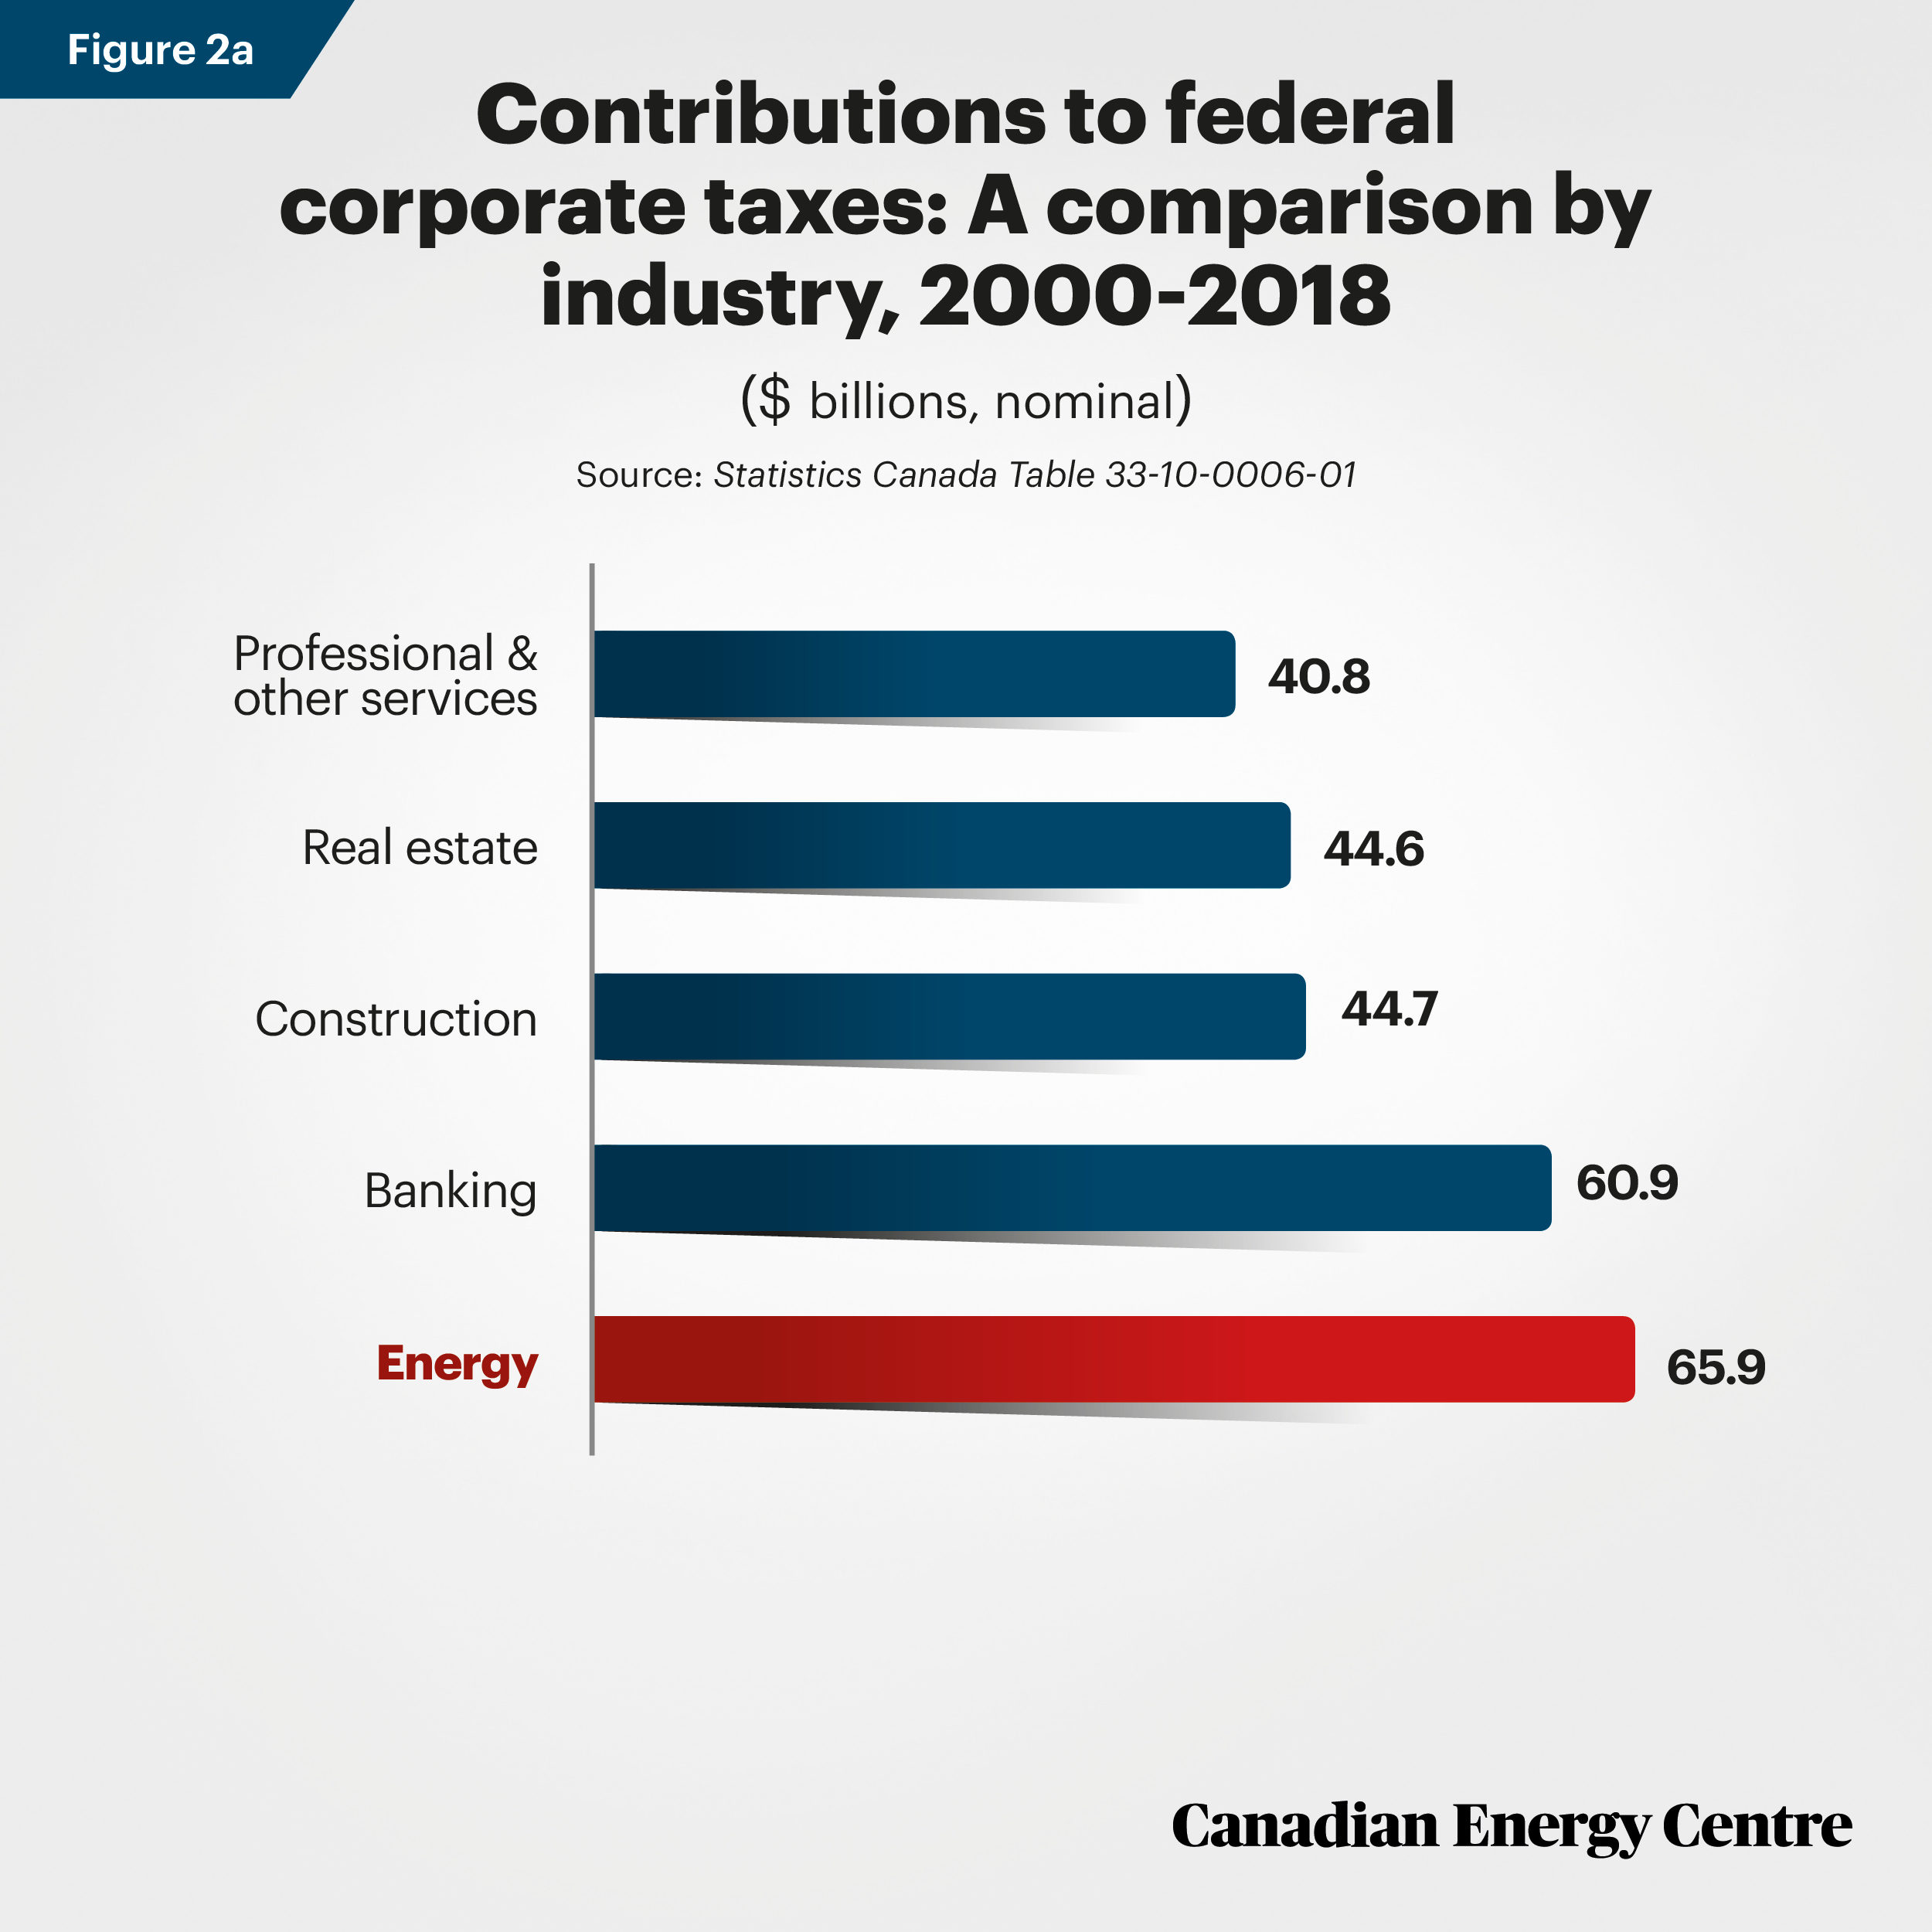
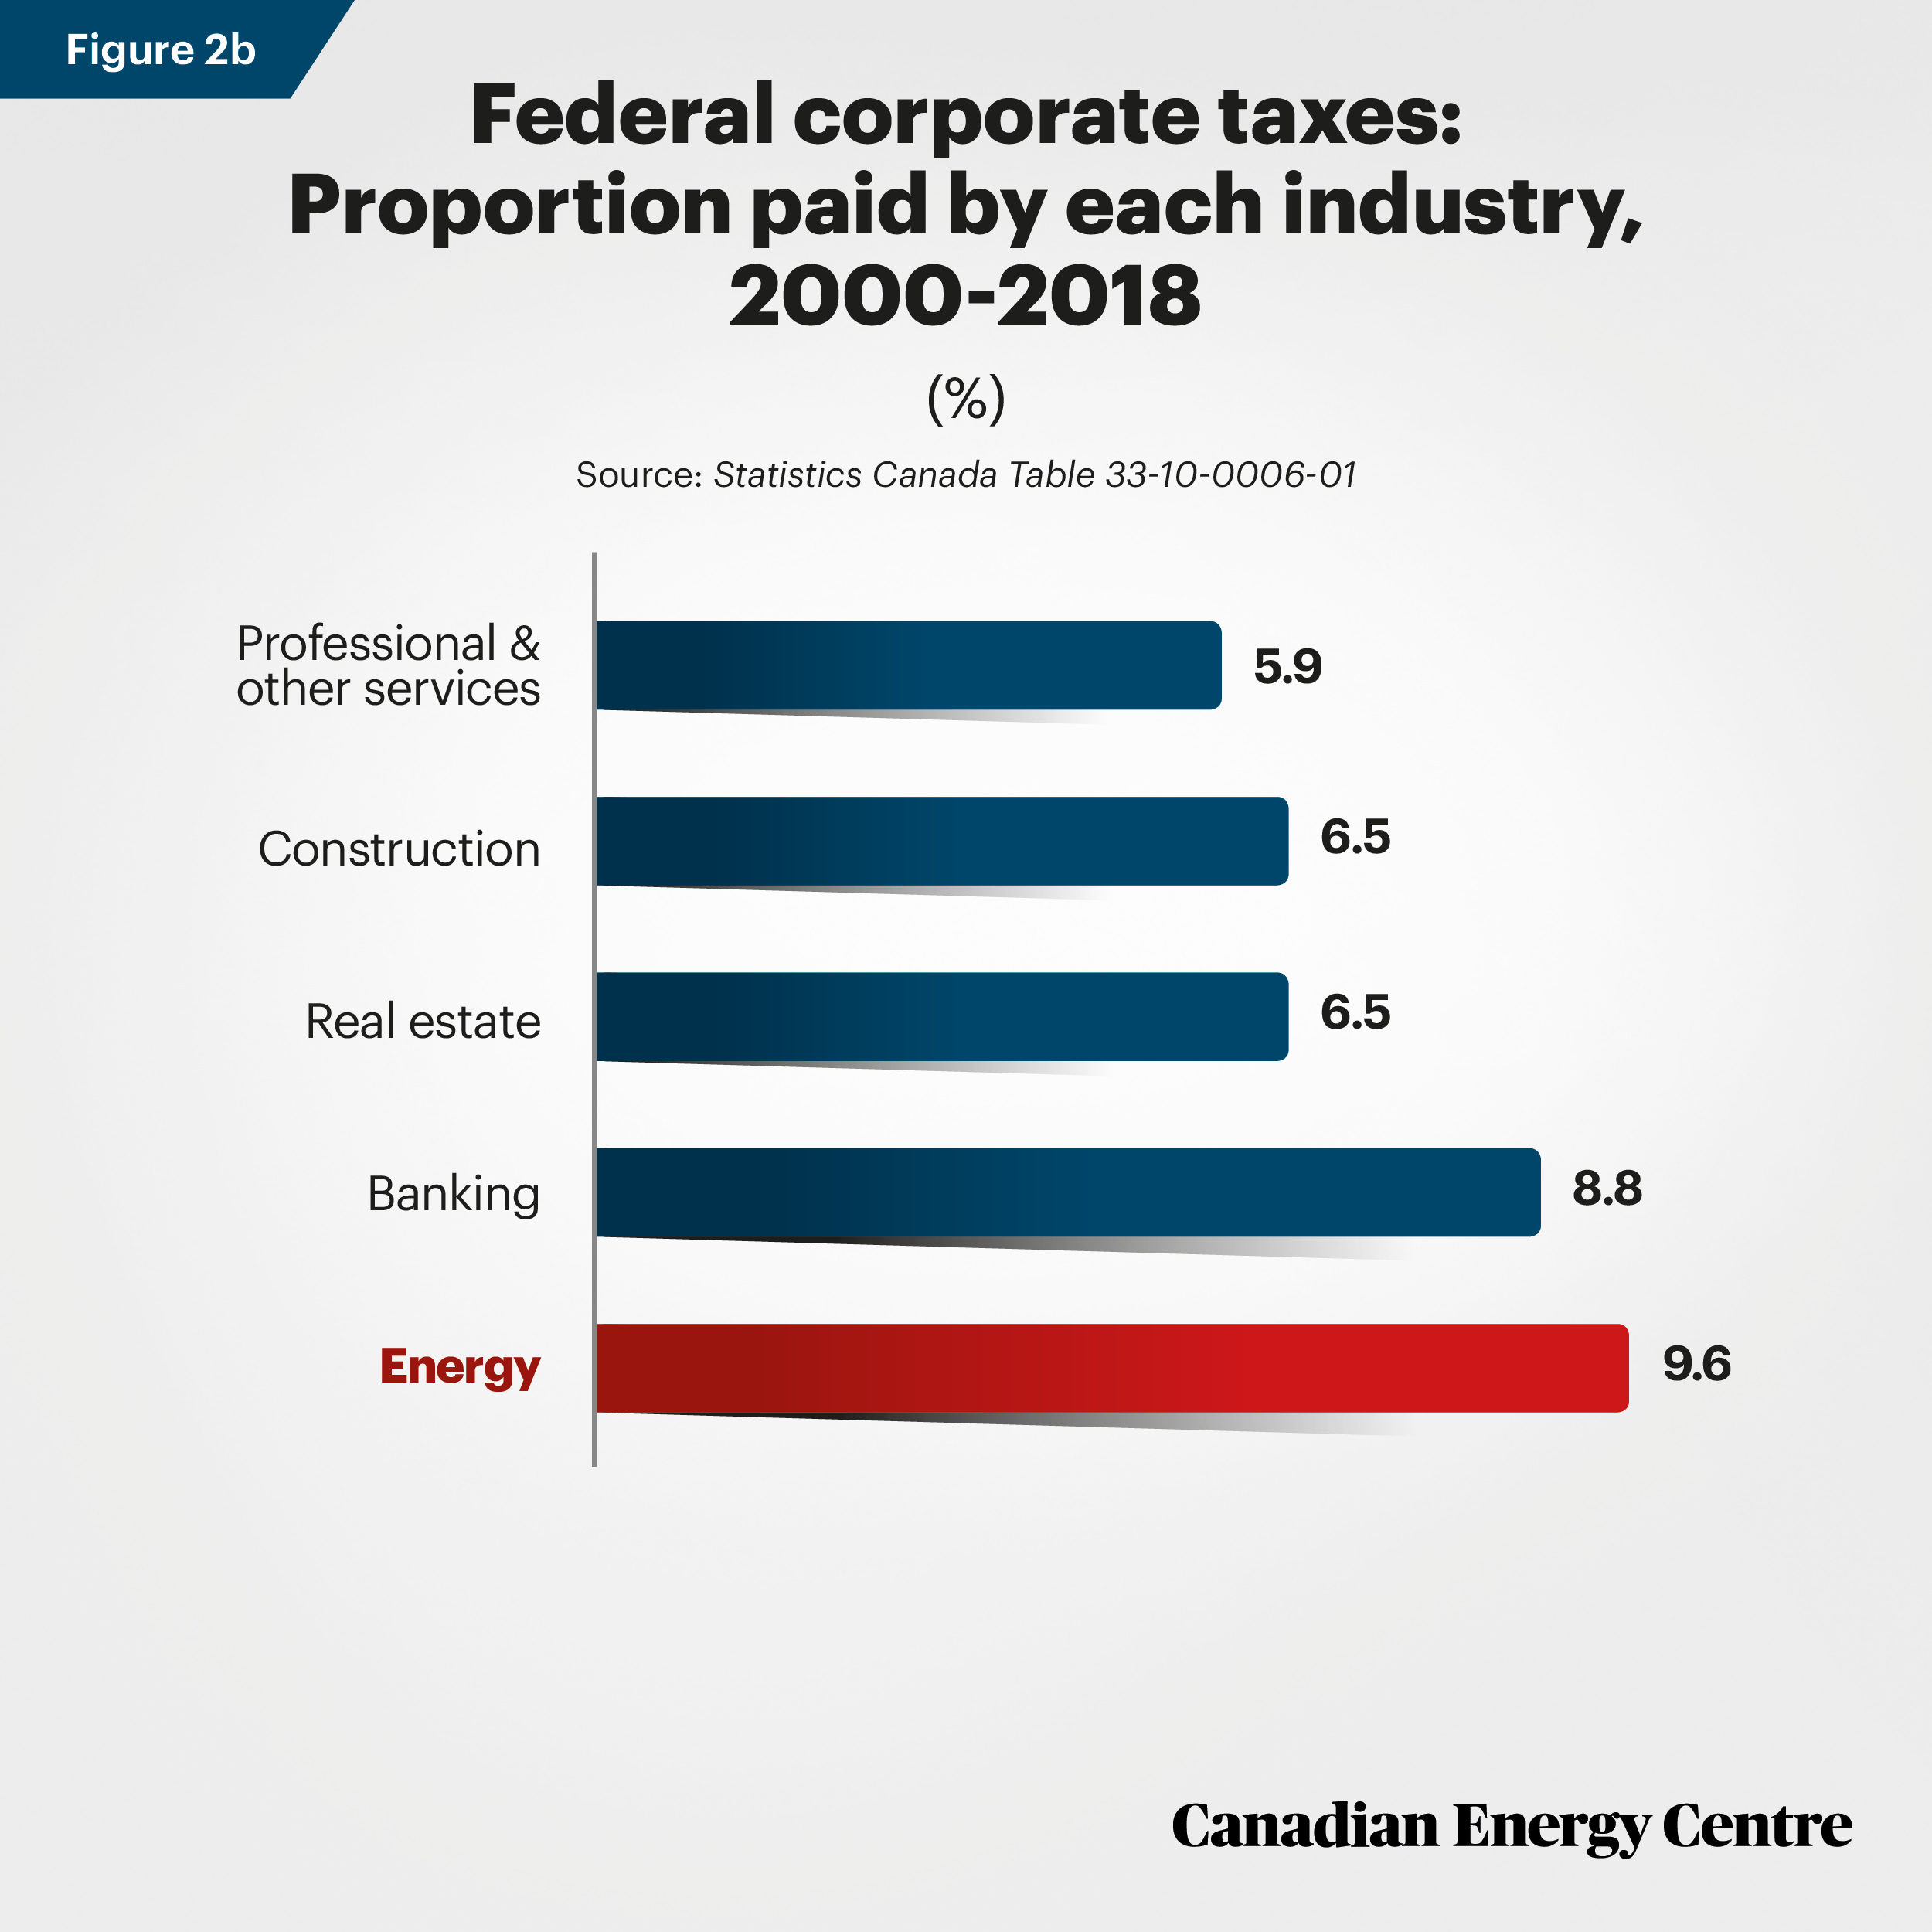
Figures 2a and 2b derived from Statistics Canada Table 33-10-0006-01.
Provincial corporate incomes taxes: A comparison
Figures 3a and 3b show the provincial corporate income taxes collected, by major sector, between 2000 and 2018. Other sectors such as real estate, banking, construction, and professional, scientific, and technical services all paid smaller proportions of such taxes than Canada’s energy sector.
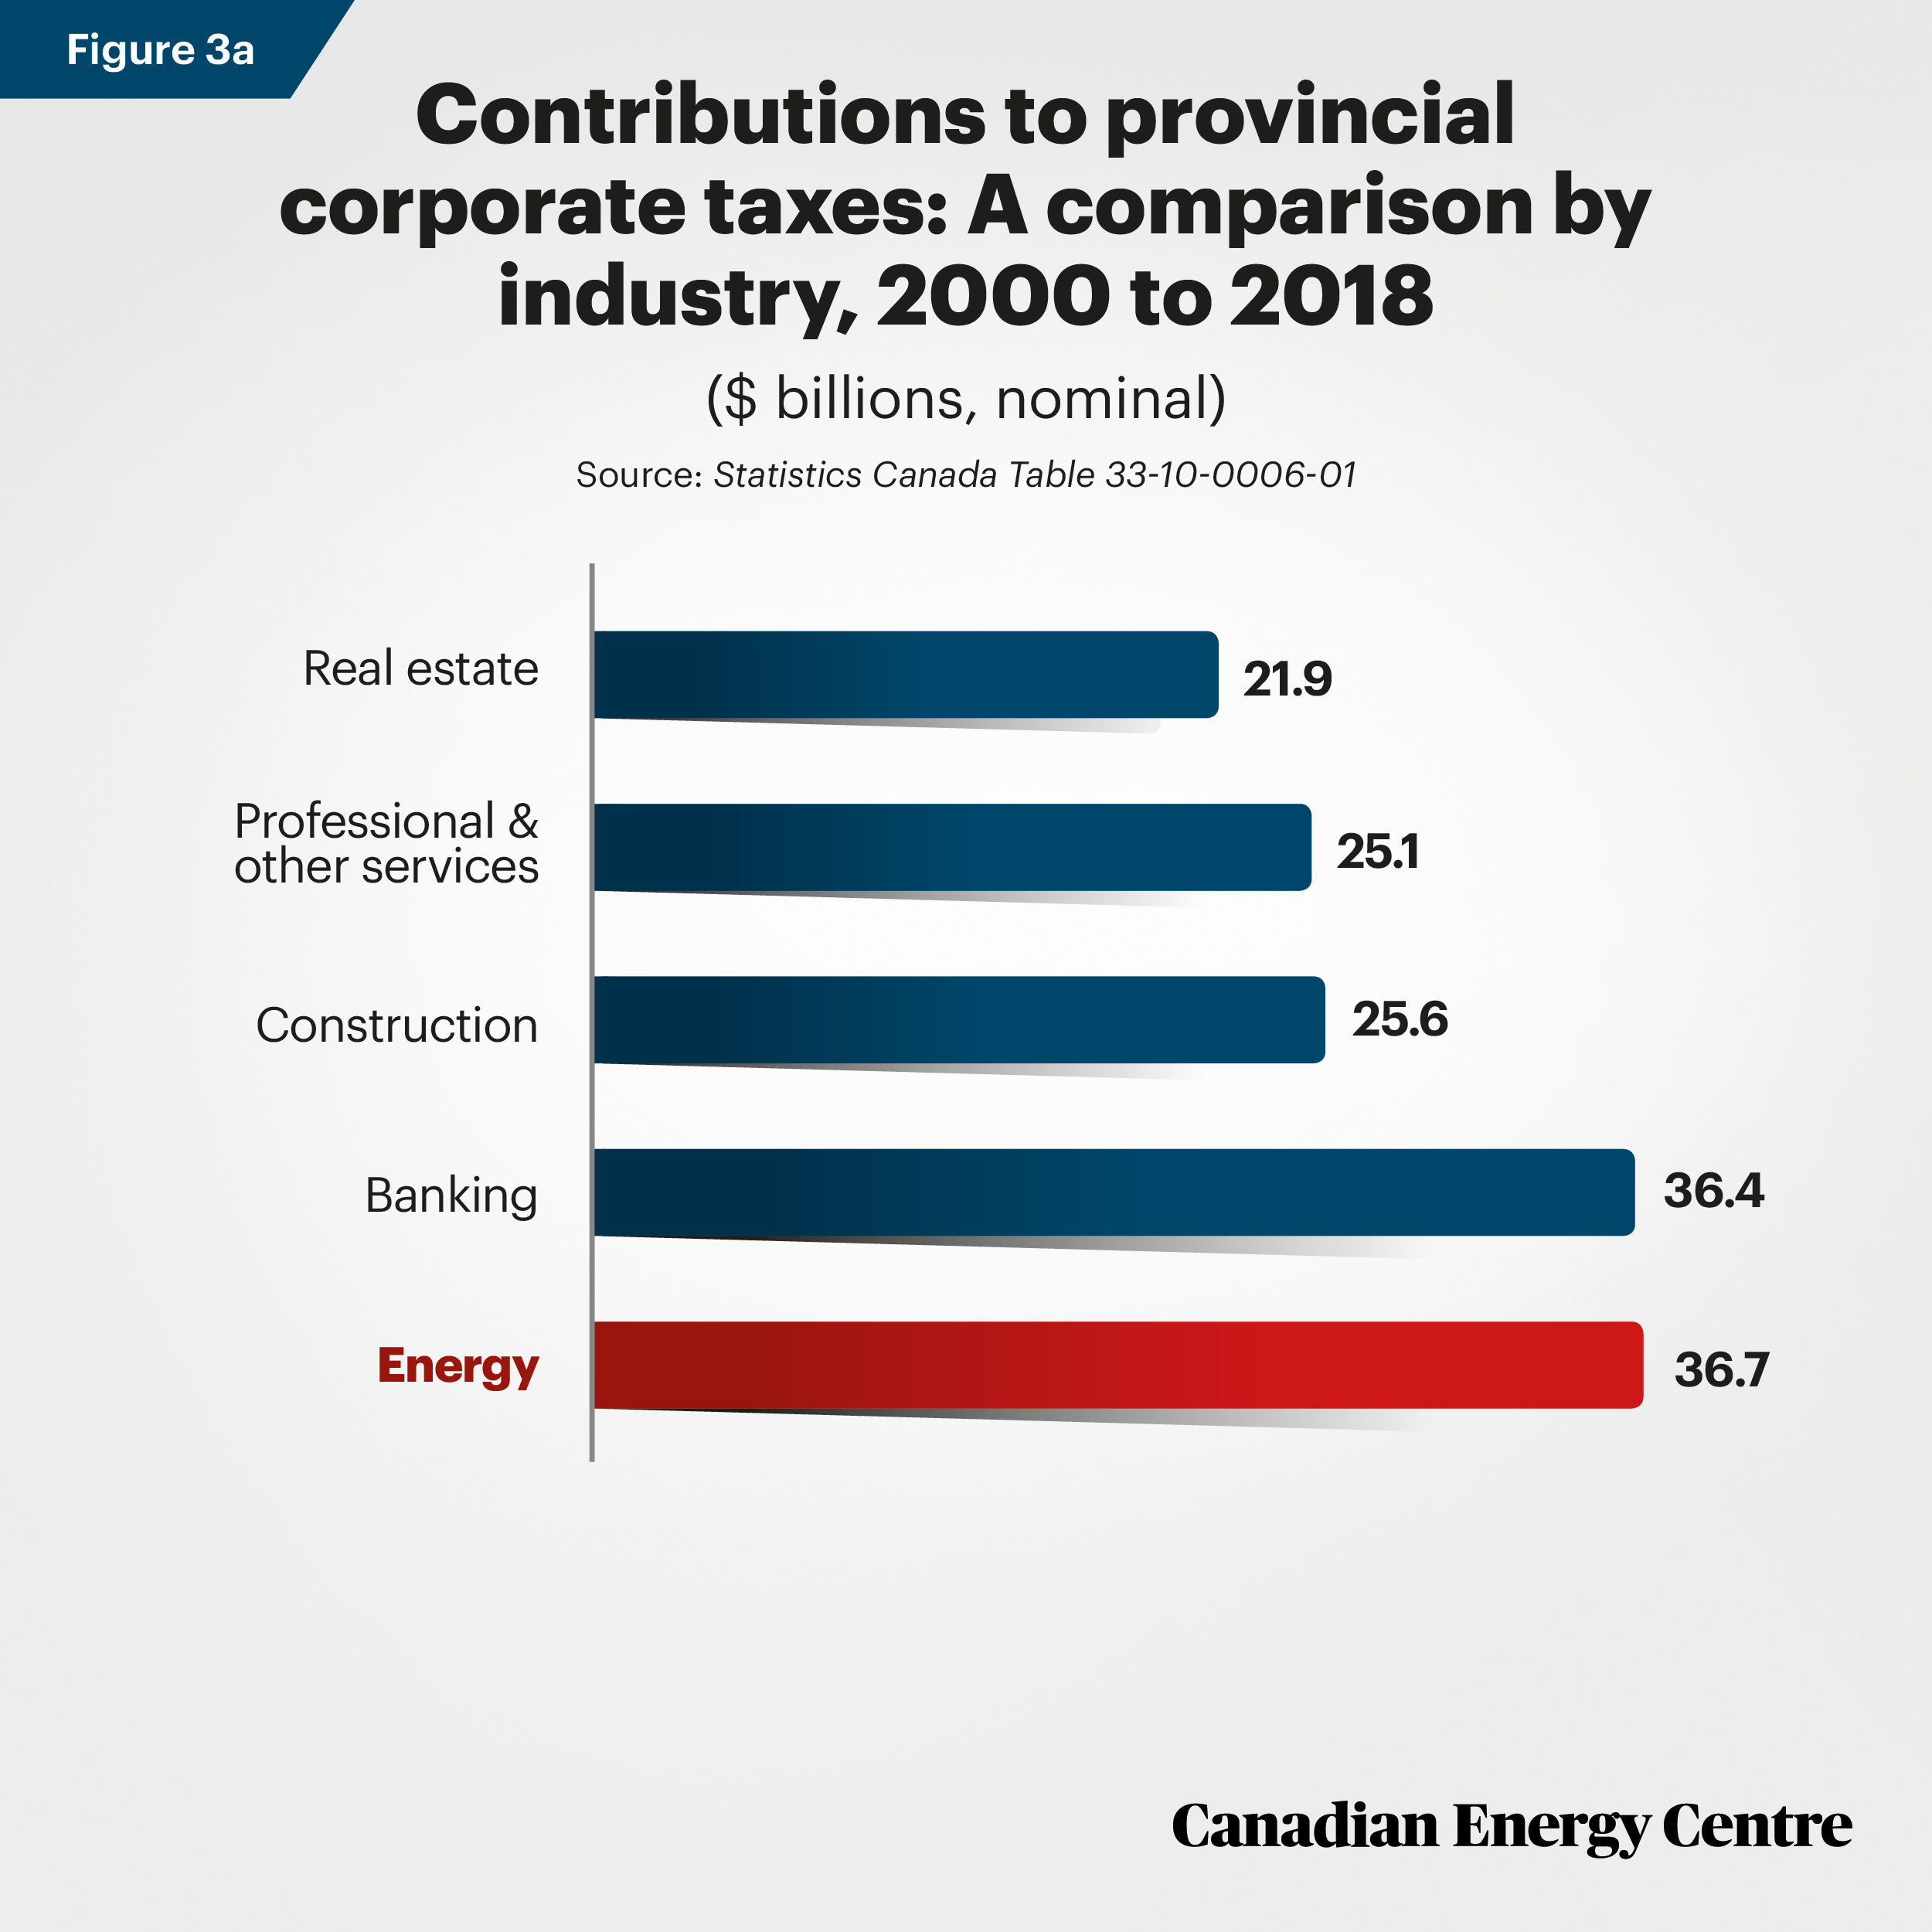
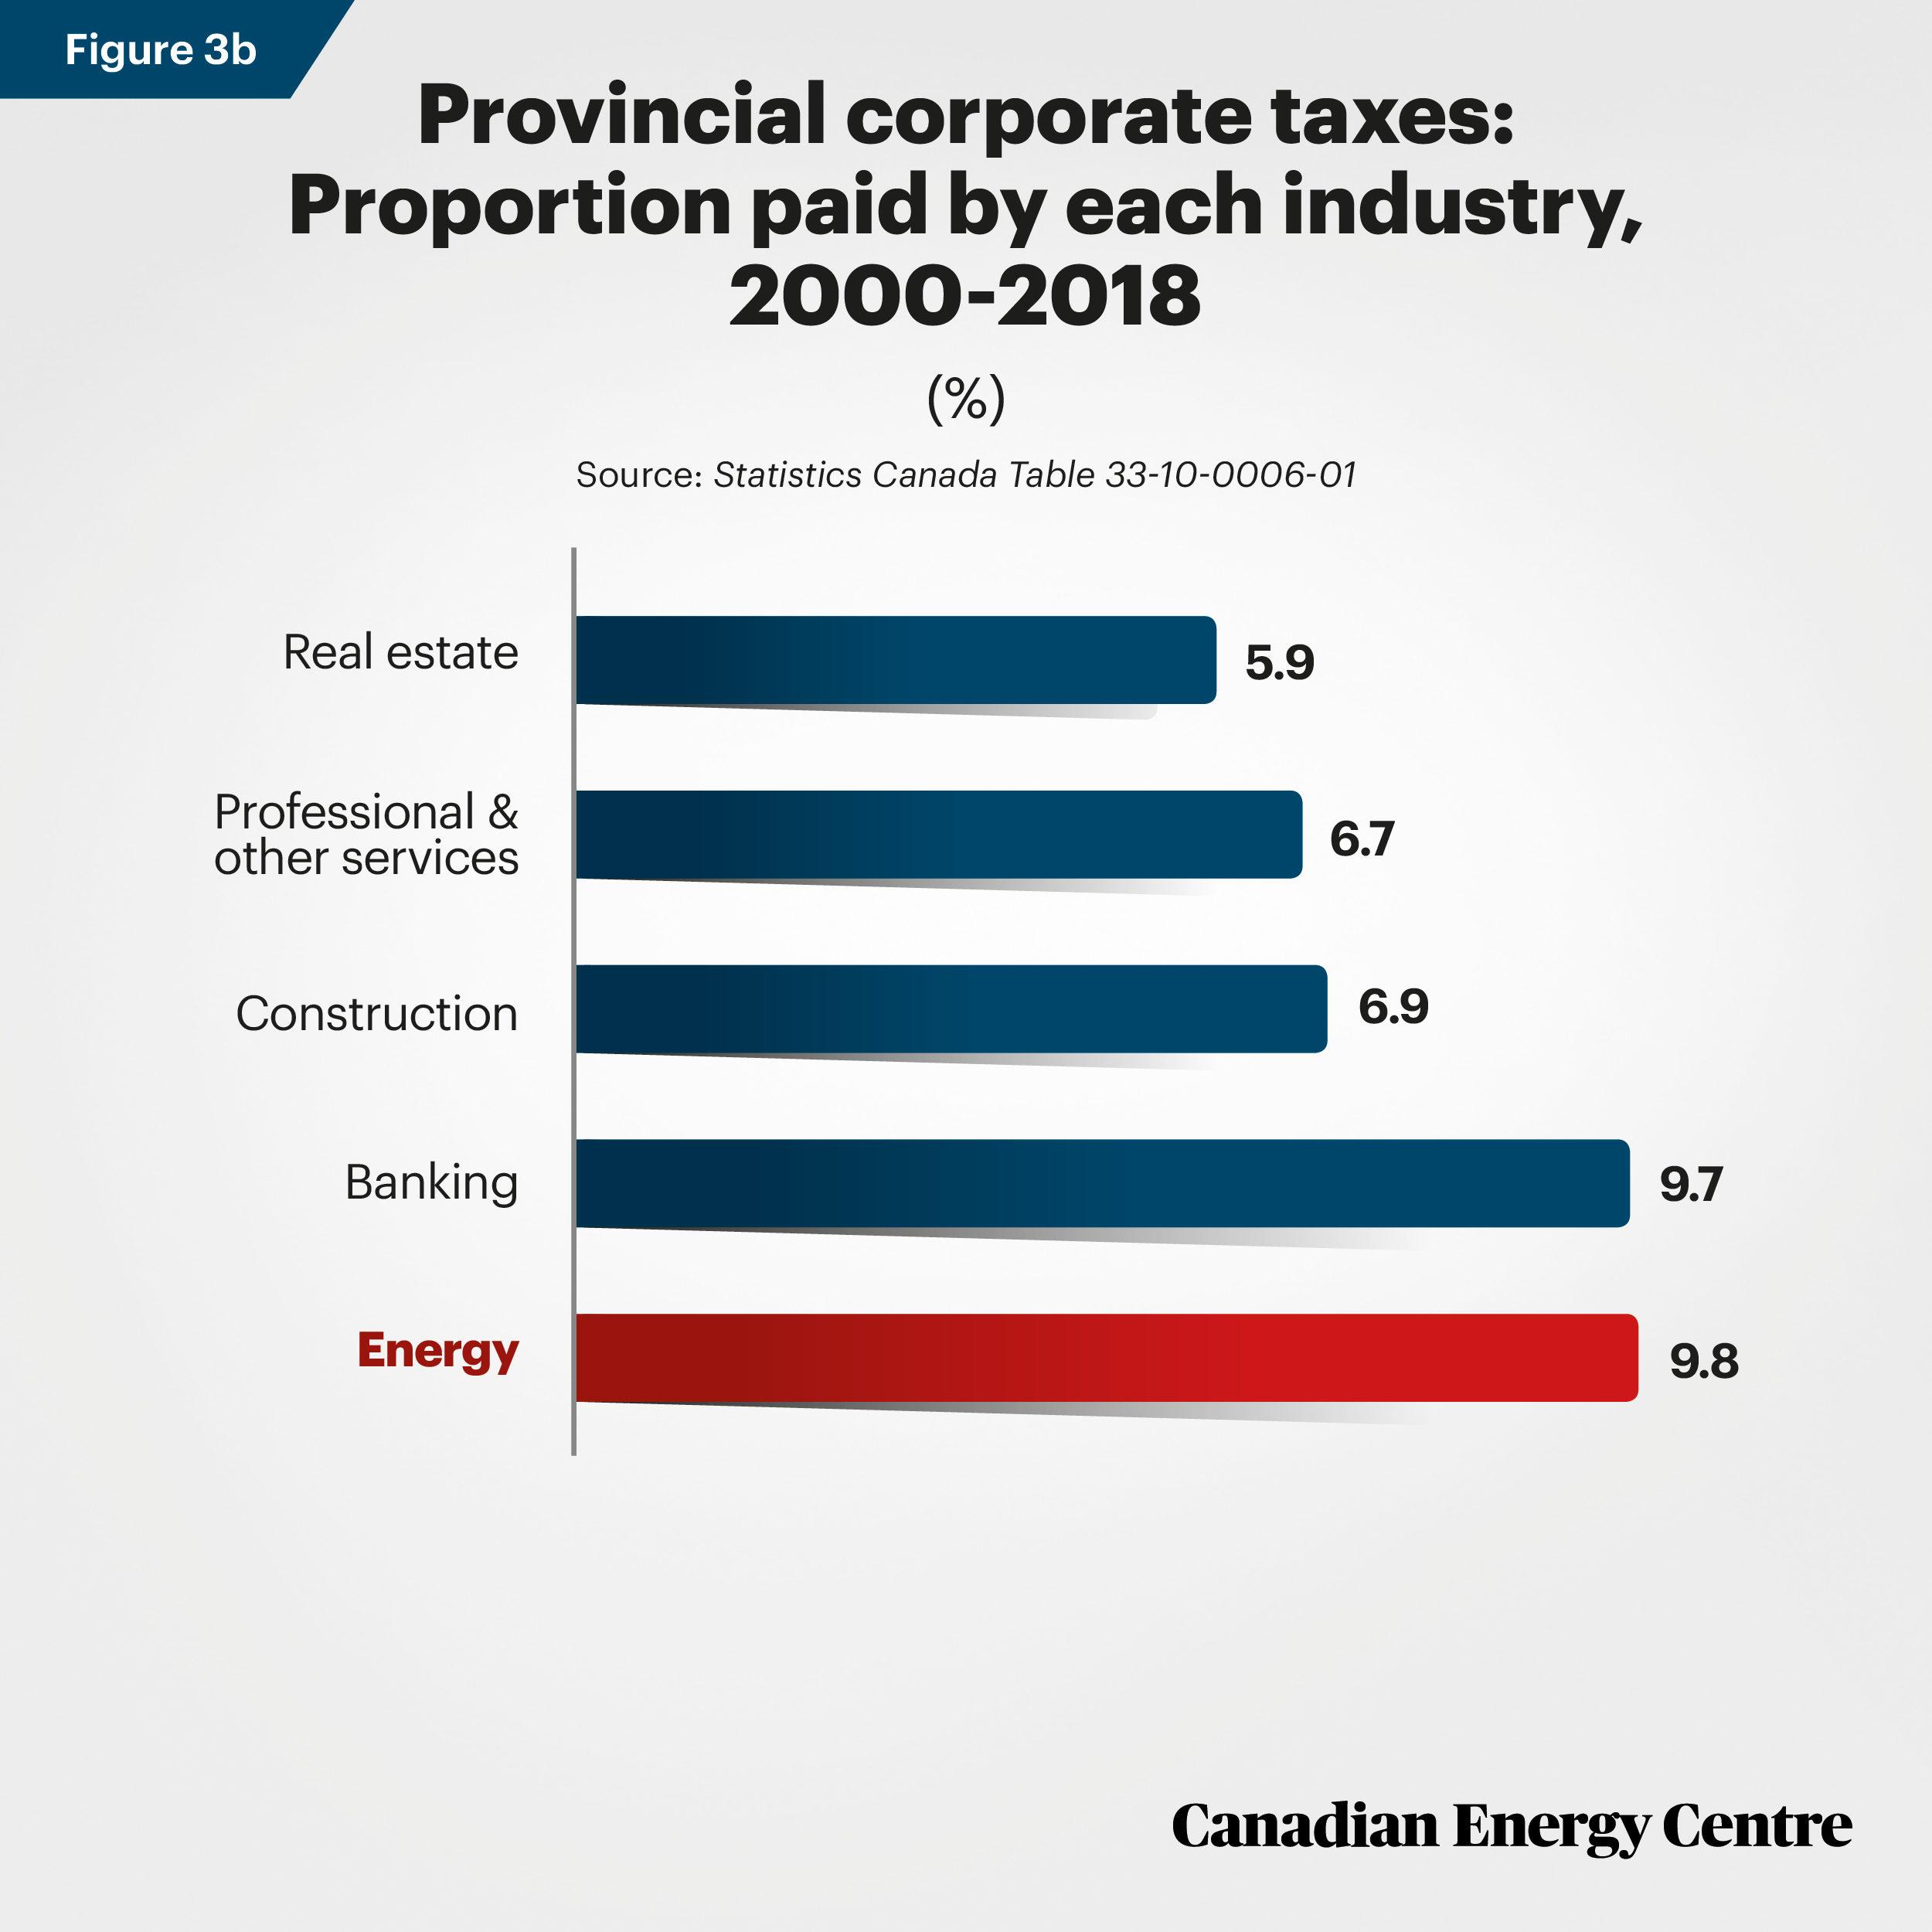
Figures 3a and 3b derived from Statistics Canada Table 33-10-0006-01.
Indirect taxes paid by industries: A comparison
Figures 4a and 4b show the indirect taxes (sales, payroll, and other) collected by federal and provincial governments between 2000 and 2018. Only the real estate sector at $75.4 billion paid more than the energy industry ($52.3 billion) in indirect taxes.
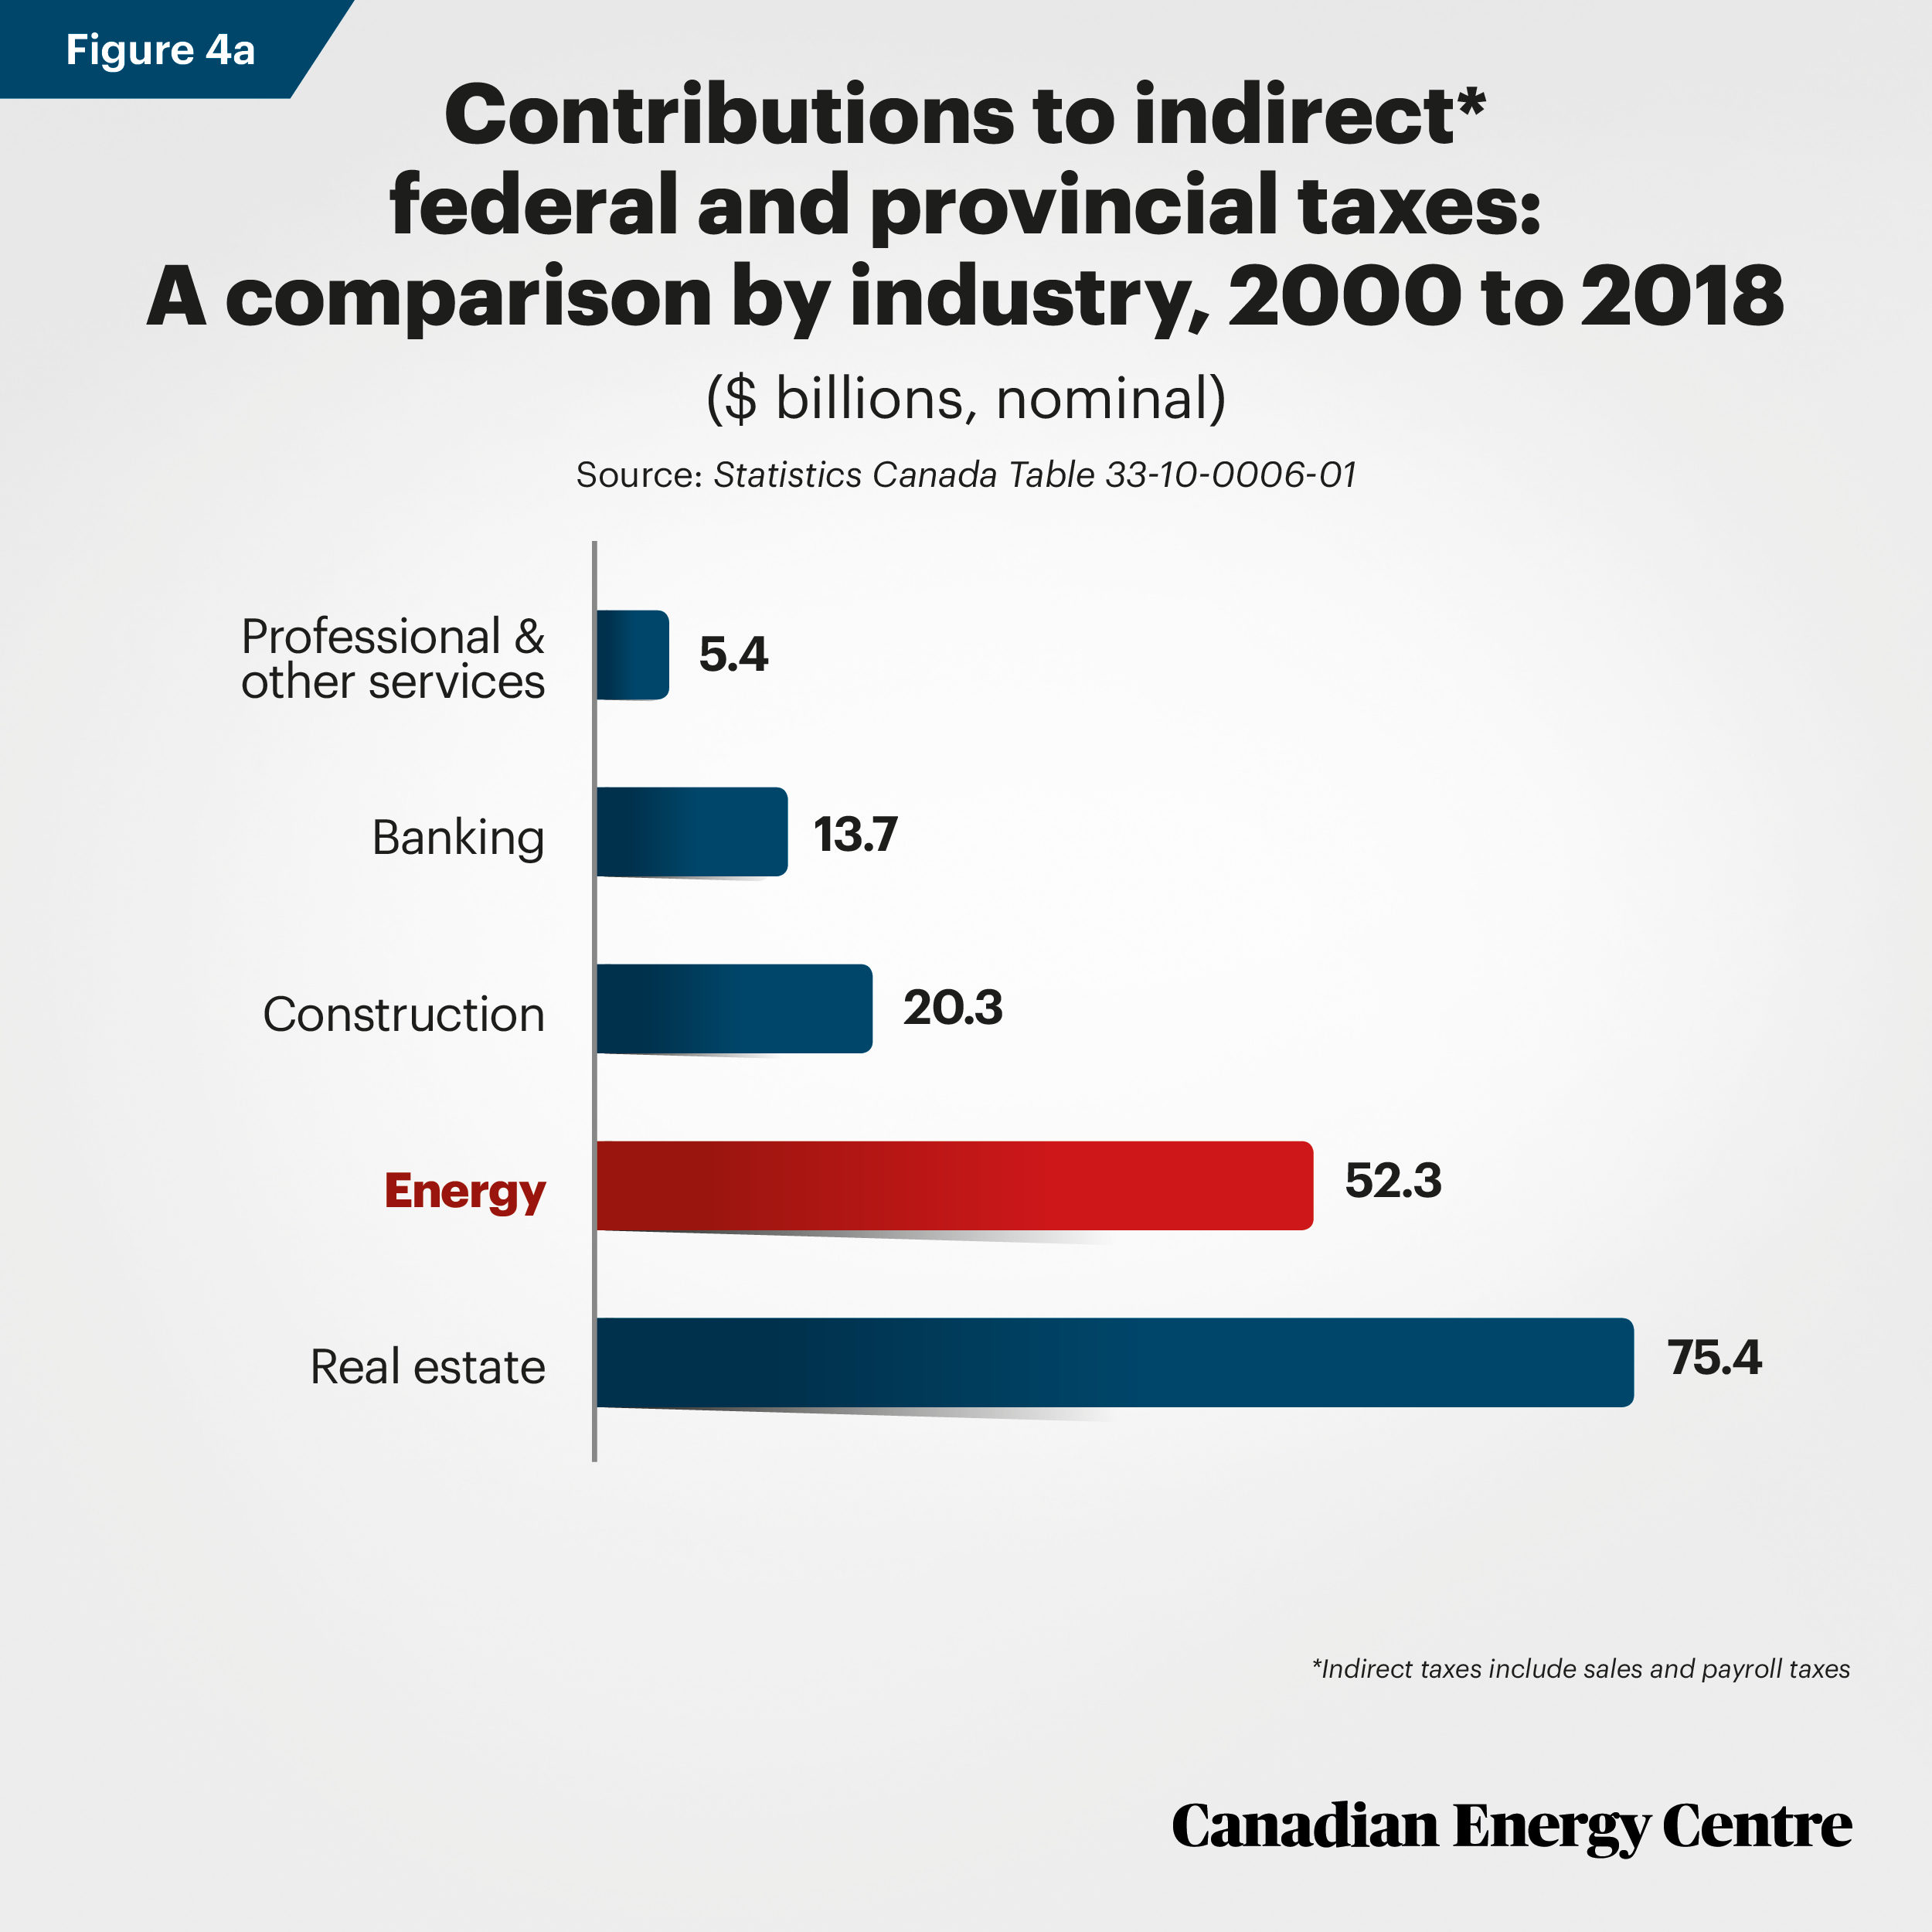
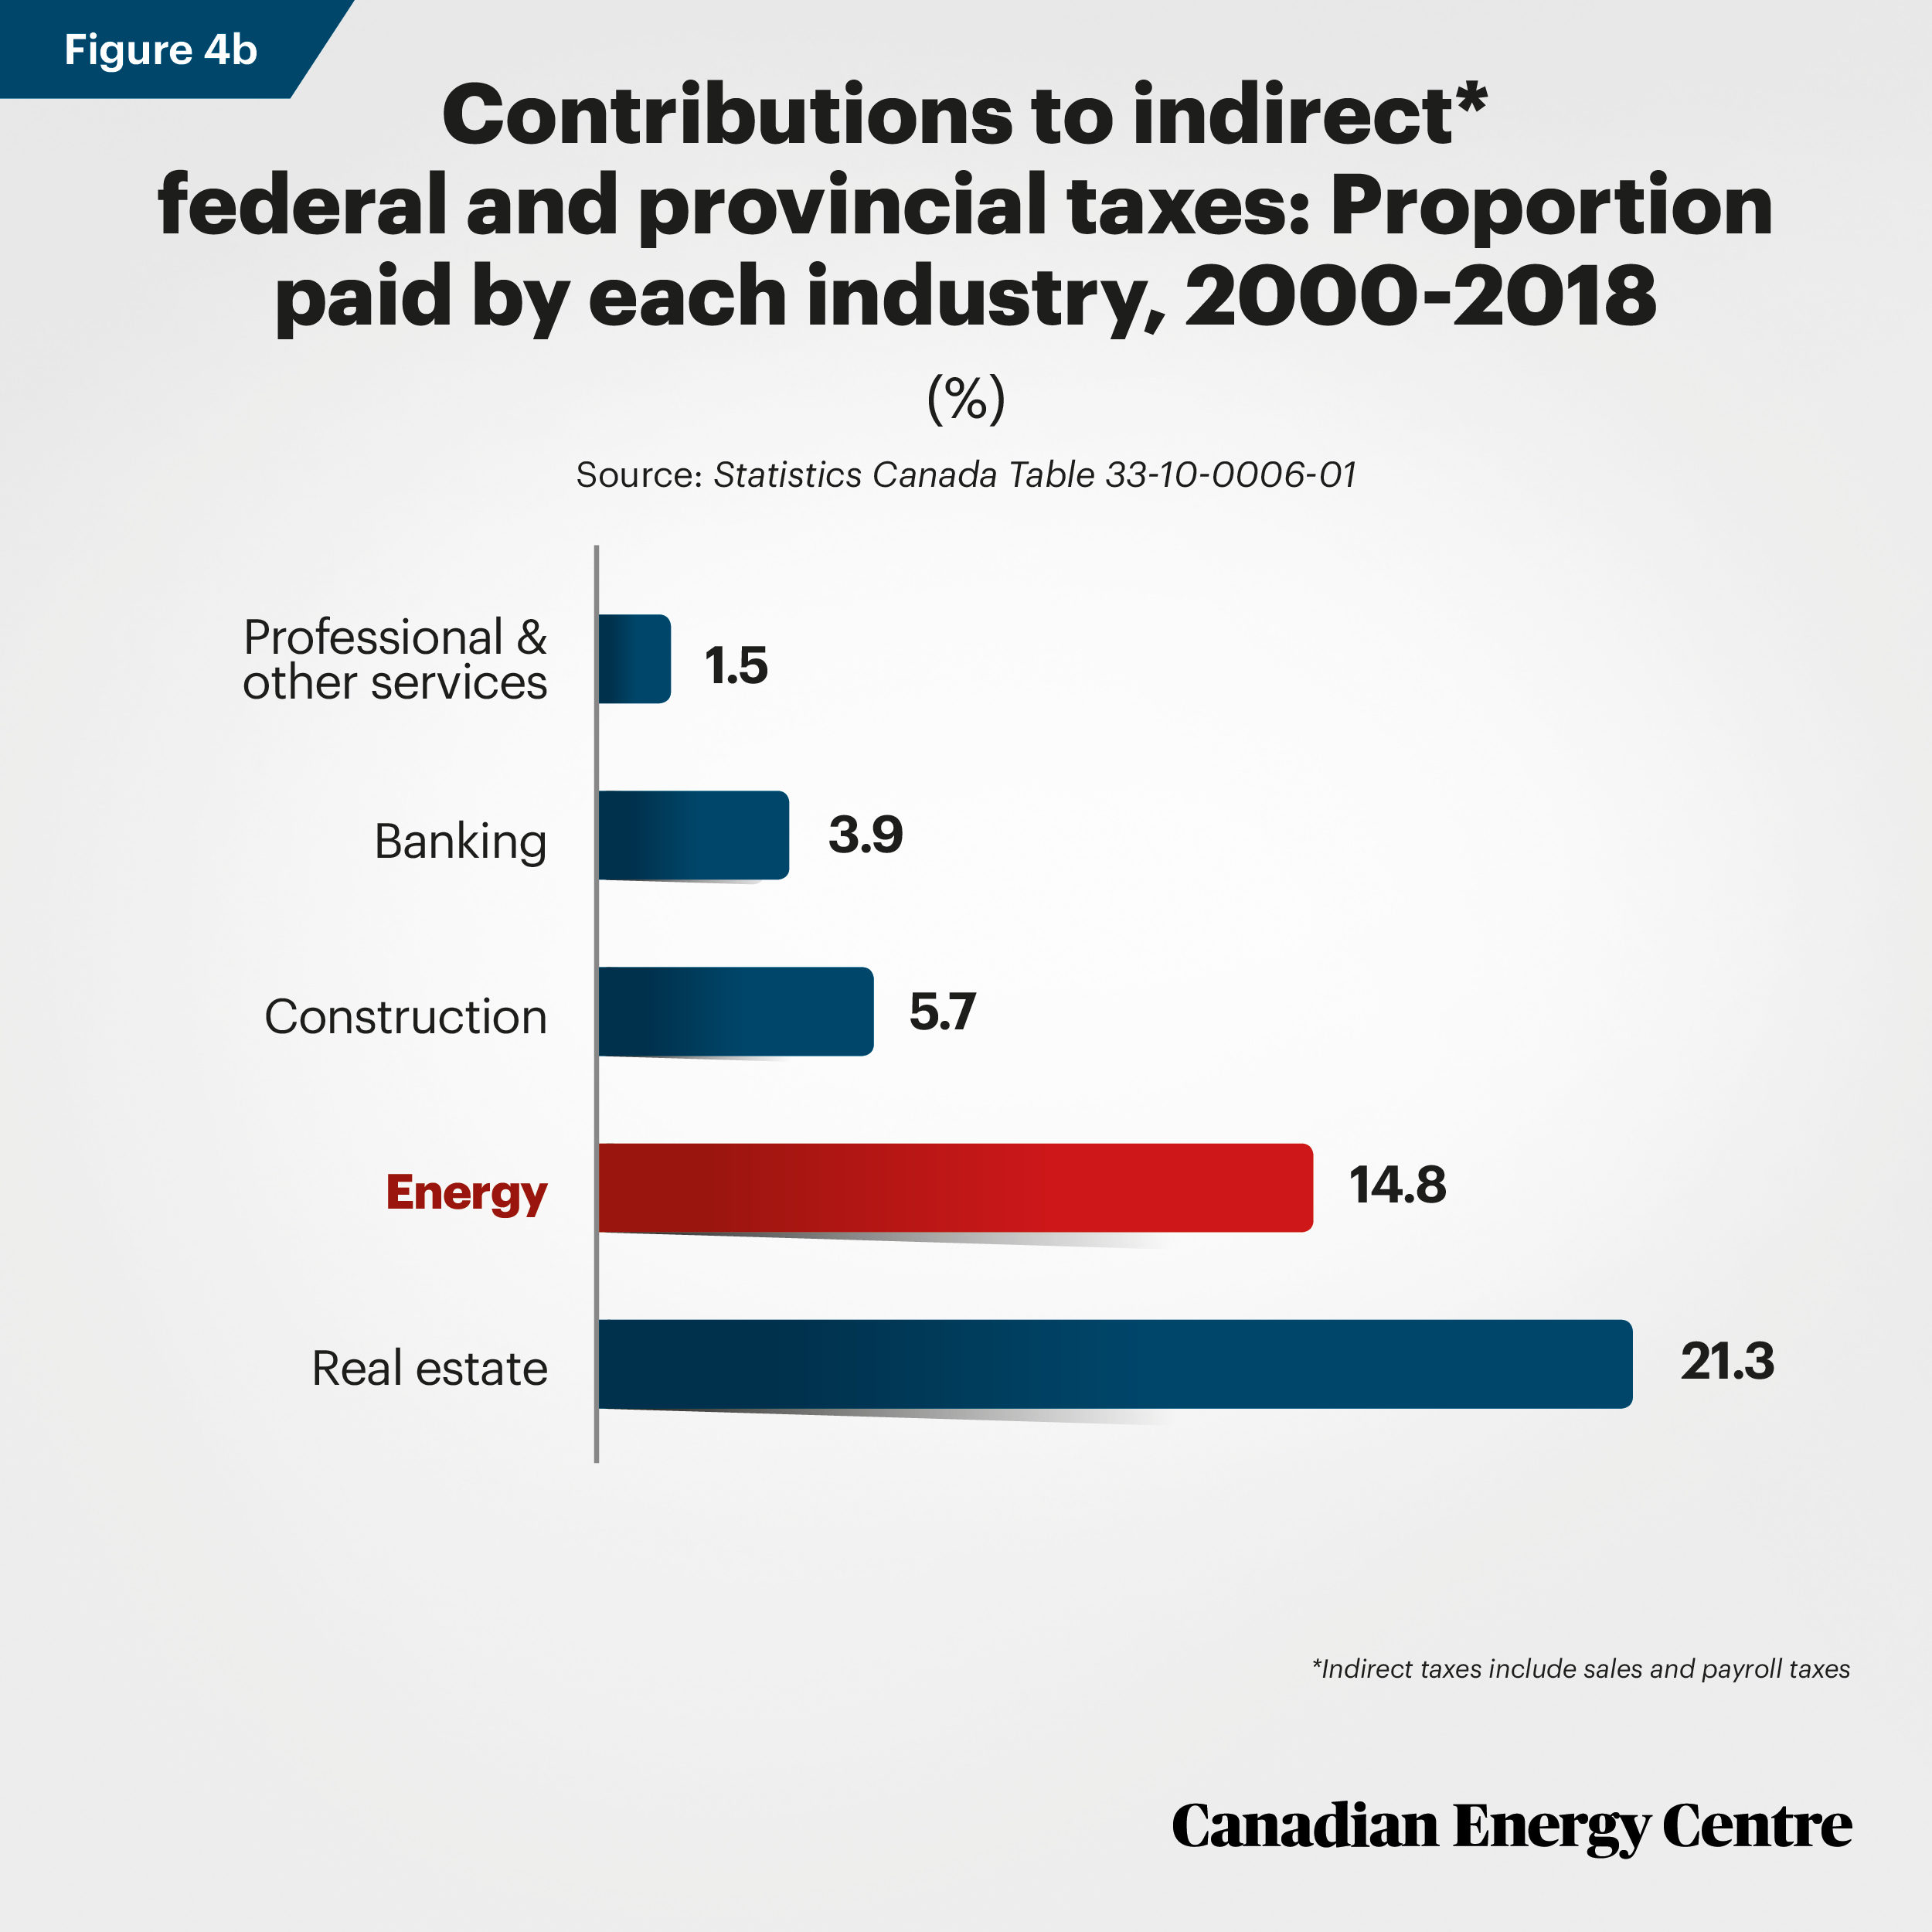
*Indirect taxes include sales and payroll taxes
Figures 4a and 4b derived from Statistics Canada Table 33-10-0006-01
The takeaway: Energy taxes matter to the bottom line of federal and provincial governments
A partial, conservative estimate of the direct taxes that Canada’s energy sector paid to federal and provincial governments between 2000 and 2018 is $359.1 billion. That figure includes almost $240 billion in direct provincial revenues, almost $66 billion in direct federal revenues, and nearly $54 billion in indirect federal and provincial taxes. That figure excludes personal income tax revenues (federal and provincial), provincial rents and royalties between 2000 and 2007, all taxes paid to municipalities and First Nations, and any adjustments for inflation.
Those energy revenues are more than triple the forecast federal budget deficit in 2020/21 of $112.7 billion, $36 billion more than the $322.9 billion in total federal program expenses in 2018/19, and almost as much as the $366.2 billion total Employment Insurance benefits paid out between 1996 and 2019.
Notes
This CEC Fact Sheet was compiled by Mark Milke and Lennie Kaplan at the Canadian Energy Centre: www.canadianenergycentre.ca. The authors and the Canadian Energy Centre would like to thank and acknowledge the assistance of Mr. Philip Cross in reviewing the data and research for this Fact Sheet.
Sources (All links live as of March 27, 2020)
Parliamentary Budget Office (2019). Scenario Analysis: COVID-19 Pandemic and Oil Price Shocks. <https://bit.ly/2QNEVKA>; Finance Canada (2019). Fiscal Reference Tables 2019. <https://bit.ly/33KEDcB>; Statistics Canada (various). Table 33-10-0006-01 <https://bit.ly/33M5Awp>; Table 10-10-0016-01 <https://bit.ly/2JhRn0K>; Table 10-10-0017-01 <https://bit.ly/3dqMMau>; Table 33-10-0006-01 <https://bit.ly/33WLdgl>.; Canadian Association of Petroleum Producers (2020). Table 1.1 Crown Land Sales Western Canada and Canada Lands. Statistical Handbook for Canada’s Upstream Petroleum Industry. <https://bit.ly/2vSy7nC>
Creative Commons Copyright
Research and data from the Canadian Energy Centre (CEC) is available for public usage under creative commons copyright terms with attribution to the CEC. Attribution and specific restrictions on usage including non-commercial use only and no changes to material should follow guidelines enunciated by Creative Commons here: Attribution-NonCommercial-NoDerivs CC BY-NC-ND.