Housing Market Recovery Index Highlights – Week Ending November 14
- The realtor.com Housing Market Recovery Index increased to 110.7 nationwide for the week ending November 14th, and an increase of 2.7 points over the prior week.
- The ‘housing demand’ component – which tracks growth in online search activity – made up for last week’s declines, increasing 13.5 points this week to 126.8.
- The ‘housing supply’ component – which tracks growth of new listings – also jumped back up past the recovery point.
- Regionally, the West is seeing visible improvements in new listings while the Northeast and South saw the largest rebounds in demand over last week.
Download the full Housing Market Recovery Index dataset here.
National Recovery Trends
Buyers and sellers quickly resumed activity the post-election week aftermath. The realtor.com Housing Market Recovery Index increased to 110.7 nationwide for the week ending November 14th, 10.7 points above the pre-COVID baseline and an increase of 2.7 points over the prior week. After seeing growth in demand and supply lose momentum earlier in the month, the pace seems to be back on track but still following the seasonal slowdown.
Despite rising coronavirus concerns, buyer interest saw a strong rebound this week, following some deceleration leading up to the election . The ‘housing demand’ component – which tracks growth in online home searches – has spent a full 28 weeks above the January recovery baseline, and increased by 13.5 points this week, to 126.8
Seller activity also rebounded in the week following the election. The ‘new supply growth’ component – which tracks growth of new listings – increased back past the recovery point again this past week, meaning the inflow of sellers remains below last year but now within the normal range of declines.
Historically, the weeks before and after Thanksgiving tend to see one last rush in activity as people try to close deals before the holidays. That will be put to the test this year, as the sharp rise in coronavirus cases across the country bring back familiar hurdles for buyers and sellers in the coming weeks.
| Week ending 11/14 | Current
Index |
w/w change | # of consecutive weeks above recovery | |
| Overall Housing Recovery Index | 110.7 | +2.7 | 18 | |
| Housing Demand Growth Index | 126.8 | +13.5 | 28 | |
| Listing Price Growth Index | 109.0 | -0.3 | 24 | |
| New Supply Growth Index | 101.1 | +5.2 | 1 | |
| Pace of Sales Index | 116.6 | -0.3 | 17 |
The ‘housing demand’ component remained visibly above recovery, and recouped setbacks over the past few weeks by rising once again to 126.8, an increase of 13.5 points over the prior week, and the highest level in a month Homebuyer interest has surpassed expectations post-pandemic, as detected on realtor.com over the last few months. While record-high prices, short supply and economic headwinds pose significant challenges, the lineup of buyers has not gotten significantly shorter since May.
The ‘home price’ component decreased slightly by 0.3 points last week, and is now at 109.0, 9.0 points above the January baseline. With supply at record lows and buyer competition showing continued strength, sellers have newfound leverage, enabling the fastest listing price growth recorded in more than two years.
The ‘pace of sales’ component – which tracks differences in time-on-market – continues to remain above the pre-COVID baseline and had a small decline of 0.3 points this past week, to 116.6. It is 16.6 points above the January baseline, suggesting buyers and sellers are continuing to connect at a faster rate going into the fall.
The ‘housing supply’ component – which tracks growth of new listings – has rebounded past the recovery point this week, to 101.1, down 2.7 points over the prior week and 4.1 points below the January baseline. While the rebound is encouraging, the inventory of newly listed homes for sale has seen a lot of variability over the past several weeks as seller confidence seems stuck in second gear.
Local Recovery Trends
The West remains the most recovered region, and saw the biggest index increase over last week. Despite seeing the smallest rebound in demand, the overall index benefited from a substantial increase in newly listed homes in larger western markets such as San Francisco and San Jose. Conversely, the Northeast and South saw the largest rebounds in buying interest, but their overall index remained largely unchanged.
| Region | Avg Recovery Index
(week ending 11/14) |
w/w change | Demand Index w/w | Supply Index w/w | Price Growth Index w/w | Pace of Sales Index w/w | |
| West | 120.0 | +5.2 | +3.3 | +16 | +0.2 | +0.1 | |
| Midwest | 108.1 | +2.5 | +7.2 | +5.5 | +0.1 | +0.3 | |
| Northeast | 107.0 | -0.6 | +10.6 | -3.7 | +0.3 | -2.2 | |
| South | 104.8 | -0.0 | +9.5 | -2.8 | -0.3 | 0.0 |
46 of 50 Largest Markets Now Above the Recovery Benchmark
Locally, a total of 46 markets have crossed the recovery benchmark as of this week, the same as the previous week. The overall recovery index is showing greatest recovery in Las Vegas, San Francisco, Seattle, San Jose and Los Angeles. Markets which are still below the baseline include Buffalo, Oklahoma, Miami, and Nashville.
In the ‘housing demand’ component, 48 of the 50 markets are now positioned above the recovery trend, four more than the previous week. The most recovered markets for home-buying interest include Austin; Boston; Buffalo; Philadelphia; and Washington, DC; with a housing demand growth index between 133 and 137.
In the ‘home price’ component, 29 of the 50 largest markets seeing growth in asking prices surpass the January baseline, three less than the previous week. In the top 10 most-recovered markets, asking prices are growing at 14 percent year-over-year, on average. The most recovered markets for home prices include Austin, Pittsburgh, New Orleans, Riverside-San Bernardino and Houston, with a home price growth index between 111 and 117.
In the ‘pace of sales’ component, 44 of the 50 largest markets are now seeing the time on market index surpass the January baseline, the same as the previous week. In the top 10 most recovered markets for pace of sales, time-on-market is now down 24 percent, on average, year-over-year. The most recovered markets for time-on-market include Los Angeles,Louisville, Las Vegas, Virginia Beach and Boston, with a pace of sales growth index between 133 and 167.
In the ‘housing supply’ component, 22 of the 50 largest markets saw the new listings index surpass the January baseline, five less than last week. Interestingly, markets where new supply is improving the fastest tend to be higher priced than those that have yet to see improvement, suggesting sellers are more active in the more expensive markets. The most recovered markets for new listings included San Francisco, San Jose, Las Vegas, Seattle and Portland, with a new listings growth index between 136 and 192.
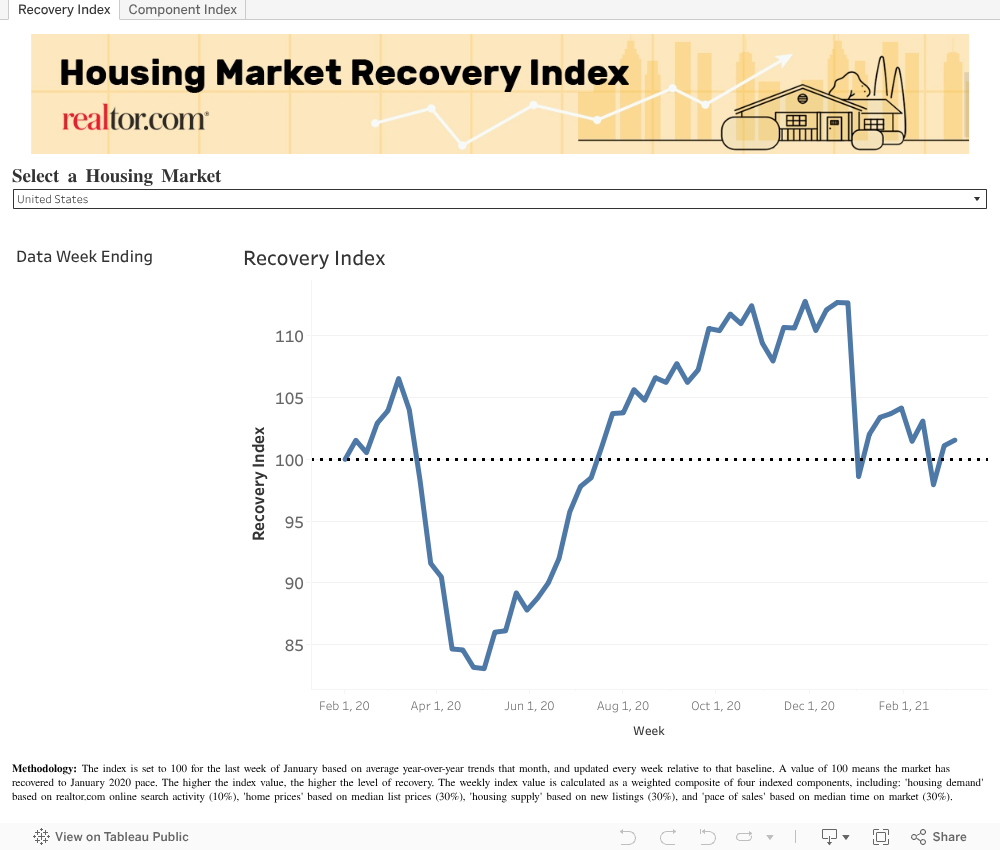
How to read the index – the overall index is set to 100 for the last week of January based on average year-over-year trends that month, and updated every week relative to that baseline. A value of 100 means the market has recovered to January 2020 pace. The higher the index value, the higher the level of recovery. The lower the index value, the lower the level of recovery.
Subscribe to our mailing list to receive monthly updates and notifications on the latest data and research.