
Key Takeaway
Regulatory agencies should consider loans per thousand people to identify Community Reinvestment Act assessment areas for branchless banks.
Summary
Community Reinvestment Act (CRA) exams scrutinize lending and community development activity in geographical areas called assessment areas (AA). In the case of traditional banks, AAs are areas around bank branches. This designation will not work in the case of branchless banks which have a headquarters office but usually no other branches. The Federal Reserve Board (board) contemplates designating AAs for branchless banks based on either concentrations of loans or deposits in various geographical areas.[1] The board also suggests that AAs be weighed on CRA exams based on the percentage of a bank’s loans or deposits in AAs.
This paper explores an alternative method for designating AAs for branchless banks. Using loans per one thousand people appears to identify smaller states and metropolitan areas that are underserved by traditional banks but are better served by branchless banks. The paper recommends that loans per thousand people be considered by the regulatory agencies as a means of identifying AAs for branchless banks and determining the weights various AAs will have on CRA exams.
Introduction
AAs (AAs) are geographical areas on CRA exams. Board-sponsored research has shown that lending increases to low- and moderate-income (LMI) borrowers and communities in geographical areas designated as AAs.[2] For traditional banks, AAs are generally areas where bank branches are located. It is intuitive that banks would increase lending to LMI borrowers and communities in areas in which they are examined since banks work harder to pass their CRA exams in these areas. In addition, branches facilitate lending when bank loan officers and other branch staff become familiar with their customers and their creditworthiness.
While AAs work well for traditional banks, how can we approach AAs in the case of branchless banks that make loans and offer bank services over the internet? Stakeholders and policymakers need to answer this question now as lenders without branches are increasingly applying to the federal bank agencies for bank charters. In addition, some traditional banks are increasing their online lending and provision of mobile bank services. Moreover, a new crop of banks and lenders receiving bank charters may increasingly offer one main product such as retail loans accompanied by an incidental number of deposits. How do we think through AAs for these types of institutions?
The Federal Reserve Board (board) has asked a series of questions in their Advanced Notice of Proposed Rulemaking (ANPR) on CRA regarding AAs and branchless banks. These questions suggest that the board anticipates an increase in lending and deposit-taking by branchless banks. For example, one question asks:
Should delineation of new deposit- or lending-based assessment areas apply only to internet banks that do not have physical locations or should it also apply more broadly to other large banks with substantial activity beyond their branch-based assessment areas? Is there a certain threshold of such activity that should trigger additional assessment areas?[3]
This paper is devoted to answering the first part of the question concerning internet banks but an approach similar to that developed here also can be applied to large banks that have branches but also conduct a substantial amount of activity beyond their branch network.
Local assessment areas are possible and preferable to national assessment areas
Some stakeholders have suggested that instead of local areas as AAs, the agencies should establish a national AA for branchless banks. The board has discussed this option in its recent ANPR on the CRA.[4]However, this approach would conflict with CRA’s mandate to address the lack of lending and redlining in local communities. Moreover, a national AA would not be as effective in motivating branchless banks to lend, serve and invest in local communities since a national AA may prompt branchless banks to lend to LMI borrowers where it is easiest to do so.
While branchless banks do not have a physical presence in neighborhoods, they nevertheless can focus on particular metropolitan areas and rural counties via digital advertising and direct mail campaigns. Some branchless banks may employ loan officers in certain geographical areas or have relationships with local brokers or correspondents. In addition, branchless banks could establish partnerships with community-based nonprofit organizations and local public agencies that could help them target particular geographical areas. It therefore seems possible and feasible to require branchless banks to serve local AAs. It will work and be an important means of increasing lending and bank services in underserved communities. The CRA reform discussion and debate has involved unresolved issues of CRA hotspots in which a disproportionate number of banks are located and CRA deserts which have few if any bank headquarters or branches. One of the most well-known CRA hotspots is Salt Lake City, Utah, in which several non-traditional lenders make their headquarters.[5] The current CRA regulatory regime allows these lenders to designate just Salt Lake City as its AA. This procedure will result in Salt Lake City receiving an abundance of traditional CRA investments like Low Income Housing Tax Credits (LIHTC) but will neglect smaller cities and rural areas in Utah as well as in other states in which these branchless banks have significant presence.
Considering examples from branchless lenders is useful for determining how local assessment areas could be established
This paper will explore the feasibility of establishing AAs for branchless banks based on data analysis of their lending activity. The paper will first discuss various approaches for designating AAs for branchless banks. It will then offer case studies of two branchless lenders that are large lenders with a national reach.
Approaches for Designating AAs for Non-Traditional Lenders
Learn from Precedent
Although the current CRA regulations have not developed a robust method for designating AAs for non-traditional lenders, a few CRA exams of non-traditional banks established important precedents that can be built upon when reforming the CRA regulations. There are some case examples of CRA examiners scrutinizing the lending of non-traditional banks beyond their headquarters in areas called supplemental areas. These exams relied upon a “Question and Answer” in an interagency document for considering lending beyond areas with bank headquarters of branches.[6]
The former Office of Thrift Supervision (OTS) supervised several lenders without traditional branch networks. The OTS relied upon the Interagency Question and Answer (Q&A) document allowing examination of retail lending outside of AAs provided the retail lending inside the AAs had adequately responded to needs. However, good lending performance to LMI borrowers outside of the AAs would not compensate for poor lending performance in the AAs, according to the Q&A.[7]
For example, the OTS 2009 CRA exam of Citicorp, a non-traditional thrift located in Wilmington, Delaware, that made loans through 77,000 agents located throughout the country, included analyses of 10 metropolitan areas and three non-metropolitan areas with the largest percentage of lending outside of the Wilmington assessment area.[8] Likewise, the OTS examined Capital One’s lending in 20 areas beyond its one assessment area. These 20 areas comprised 25 percent of the thrift’s lending.[9]
The approach laid out by the OTS has been adopted by other agencies (including the OCC), and as a result, it has become the de facto standard. We would contend that the OTS’ first-look response deserves re-examination, and that the gains in market share of these companies places significant urgency on the resolution of a better method for assigning AAs.
A more recent OCC exam of the Bank of the Internet further developed procedures for considering loans outside of AAs.[10] Since AA lending in San Diego accounted for 1% of total lending activity, an examiner with the OCC evaluated retail lending in six states outside the San Diego assessment area.[11] Bank of the Internet’s activity in these six states accounted for 30% of total deposits and 56% of home mortgage and small business lending.[12] The retail lending in the states outside of the San Diego assessment area was factored into the rating for the lending test.[13]
These exams are important precedents. They show it is feasible to use data on lending and deposit taking activity for non-traditional banks to designate states, metropolitan areas and rural counties as geographical areas on CRA exams. As pioneering cases, these examples also have limitations. For instance, it is not clear how much weight the areas beyond the bank headquarters had on the CRA exams.
Building upon Precedent and Establishing Principles for Designating AAs
The designation of AAs for branchless banks must be guided by clear principles in order to maximize the effectiveness of CRA exams. This would result in increases in lending, investment and services for LMI communities, while also creating exams that are feasible and reasonable for lenders.
Principles for designation of AAs include robustness, comprehensive coverage of bank activity, transparency and feasibility. Robustness includes establishing rigorous examinations that accurately measure the level of bank activity in LMI communities and does not gloss over areas in which a bank is performing poorly. Comprehensive coverage refers to AAs covering the great majority of bank activity. Transparency includes establishing a procedure for designating AAs that is clearly described and is fair for both banks and community organizations. Feasibility involves creating an AA designation procedure that does not overwhelm the business model of a lender, rendering it improbable that the lender can perform adequately in the AAs.
Each of these principles and tradeoffs in concrete terms mean:
Robustness: Current CRA exams designate full-scope and limited-scope AAs. Full-scope AAs receive the most rigorous CRA exams while limited-scope AAs undergo a cursory examination. Poor performance in limited-scope AAs rarely affects the bank’s CRA rating unless the performance is consistently worse as revealed by quantitative performance measures. The limited-scope AAs have been traditionally applied to medium and smaller metropolitan areas and rural counties. As a result, banks are not as motivated to address the credit and capital needs in these areas. The agencies have tried to improve upon these disparities by saying a bank’s presence or market share in AAs, and not only the overall lending or deposit volume, will elevate AAs to full scope status. However, the agencies have not reported on whether these changes in examination procedure have in fact elevated the importance of smaller metropolitan areas and rural counties, which are often the most underserved areas.
Comprehensive coverage: In a previous report on the largest 100 banks by asset size, NCRC found that the median percentage of banks’ home and small business loans covered by AAs was more than 90% of their home and small business lending. At the same time, some banks had less of a majority of their loans covered by AAs. NCRC found that banks with less than 75% of their loans covered by AAs had higher ratings on their lending test than banks with more than 75% of their loans covered by AAs. The difference between ratings was greatest in the case of banks with over and under 50% of their loans covered by AAs. This does not mean that there were no other factors contributing to the higher ratings for banks with less AA coverage of their loans. However, it suggests that covering the great majority of loans with AAs is desirable, particularly when board research revealed a positive impact on lending increases to LMI borrowers and communities due to geographical areas being designated as AAs.
Transparency: Exams are not consistent in describing how AAs were established, why some AAs are full-scope AAs while others are limited-scope and the weight of the AAs. Reforming AA procedures must also include improvements in transparency in their description so members of the public can judge whether banks are being rigorously examined.
Feasibility: Some large branchless lenders make tens of thousands if not hundreds of thousands of loans annually and rival the largest banks now in terms of their loan volumes. Should policymakers therefore expect that these branchless lenders should have a similar number of AAs as the largest banks? Can branchless banks be expected to offer as high a percentage of loans to LMI borrowers and communities as banks with branches in their AAs?
NCRC’s previous report of the 100 largest banks found that the top 10 banks had a much greater number of AAs than the other 90 as shown in Table 1. The top three had a median number of 227 while the top ten had a median number of 105.
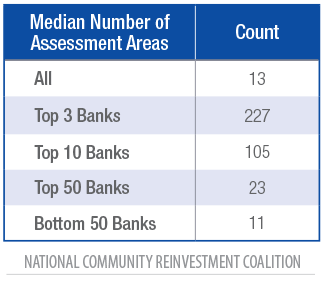
Should we therefore expect the largest branchless lenders with loan volumes similar to the three largest banks to have between 100 to 200 AAs while most branchless banks would likely have 50 AAs or less? Below, two large branchless lenders are selected for case studies with similar loan volumes as the very largest banks.
The number of AAs is also related to measuring performance in the AAs. Is it feasible to assess branchless bank performance in several AAs since NCRC research has found that banks without branches in a geographical area perform worse in terms of the percentage of loans to LMI borrowers and communities than banks with branches in a geographical area?[14]
Additional research is needed to determine if this pattern holds true for branchless lenders seeking bank charters. If it does, a way to account for this is to compare branchless banks against peer banks in AAs rather than traditional banks. In other words, a branchless bank’s percent of loans to LMI borrowers would be compared to the percent of loans to LMI borrowers made by other branchless banks instead of traditional banks. Alternatively, an exam can compare branchless banks against other branchless banks and traditional banks but weigh the branchless bank comparison to a greater extent in the calculation of the rating. In the early years of applying CRA exams to branchless banks, a balancing act should ensure that branchless banks are not simply failed en masse but are encouraged to improve their performance by a careful calibration of performance measures.
In terms of the numbers of AAs, one approach to increasing feasibility is to use full-scope and limited-scope AAs. As shown in Table 2, the great majority of AAs are limited scope for the top 100 banks in the previous NCRC paper.
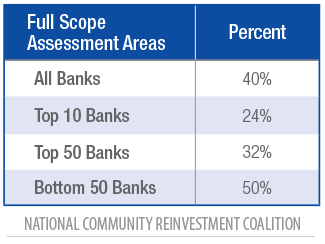
However, as stated above limited-scope AAs may result in banks not offering as many loans, investments and services to LMI populations, particularly in smaller metropolitan areas and rural counties. The Board is contemplating the elimination of the distinction of full-scope and limited-scope AAs, an approach that NCRC favors.[15] An alternative to full-scope and limited-scope AAs is discussed below.
The case studies immediately below will flesh out the application of principles of robustness, comprehensiveness, transparency and feasibility in greater detail and their tradeoffs.
Case Studies
Consider Ordering States for AA Priority by Loans per Thousand People
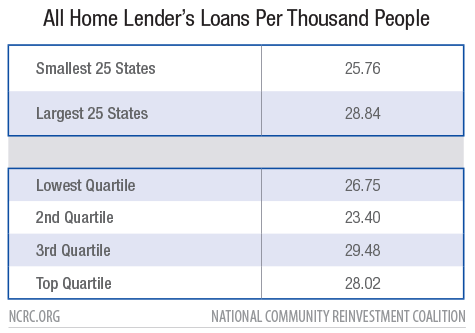
A ranking method of loans per 1,000 people appears effective at elevating the importance of smaller states that are also underserved as shown in Table 3 below. When considering loans made by all lenders per 1,000 people, the smaller states have the fewest loans per thousand people. In the top 25 states ranked by population, all lenders reporting Home Mortgage Disclosure Act (HMDA) data issued a median of 28.9 loans per 1,000 people. In the bottom 25 states ranked by population, all lenders issued a median of 25.7 loans per 1,000 people. Medians by quartile of states ranked by population revealed a similar disparity.
Should CRA examiners therefore list states in reverse order for AA selection so that the smallest states with fewer loans per thousand loans receive heightened priority? Would this procedure work for branchless lenders?
Lender A Case Study Shows Sorting AAs by Home Loans per Capita Targets Underserved States and Areas
This paper selected a large branchless home lender as the first case study. Its data is publicly reported under Home Mortgage Disclosure Act (HMDA). The name of the lender has been concealed because this paper is not interested in examining a particular lender but focused on how to designate local AAs for branchless lenders.
Lender A’s Lending by State Sorted by Total Numbers of Loans
Table 4 below shows the states in descending order for Lender A’s lending in 2019. The most populous states tend to be clustered in the top half with California, Florida and Texas in the top five states with the most loans. Adding the loans of the top 20 states by loan volume would result in about 431,000 loans or 78.5% of Lender A’s total loans. Following the principle of comprehensiveness, selecting AAs within the top 20 states would cover the great majority of Lender A’s loans. However, this selection process could violate the other principle of robustness by concentrating on states that tend to be banking oases based on their large population sizes.
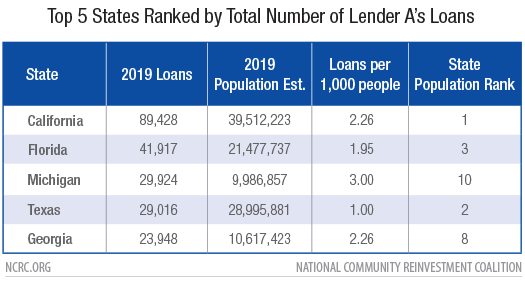
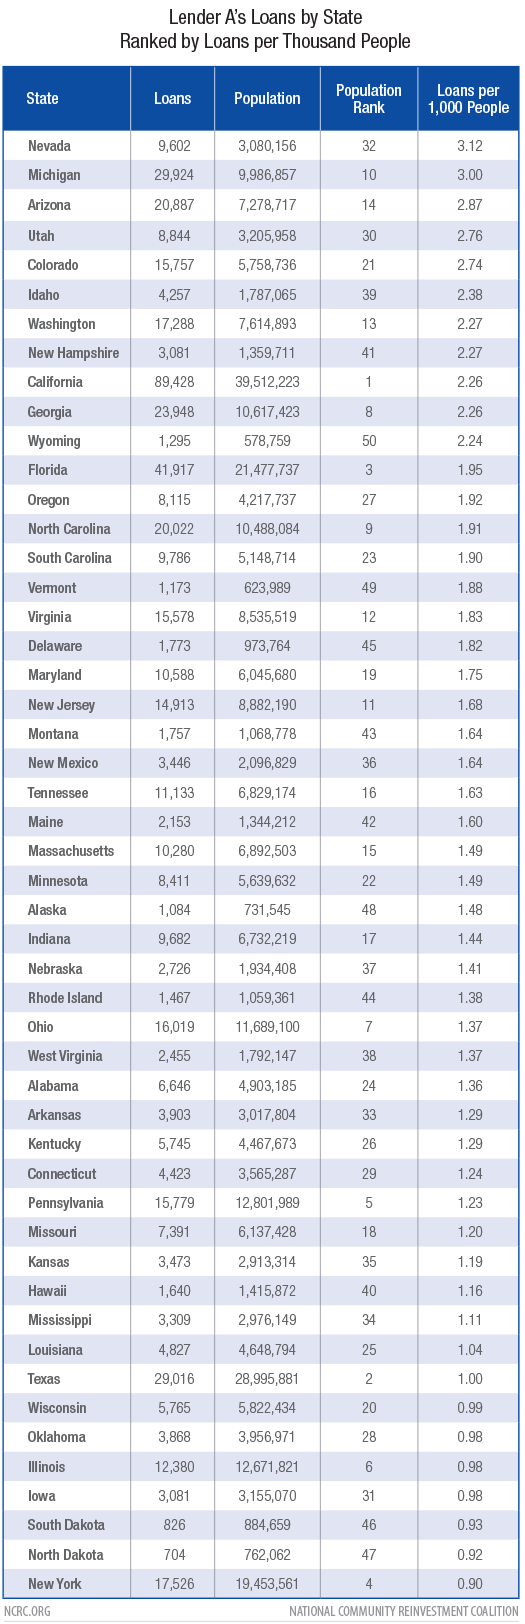
Order States Based on Lender A’s Loans per 1,000 People
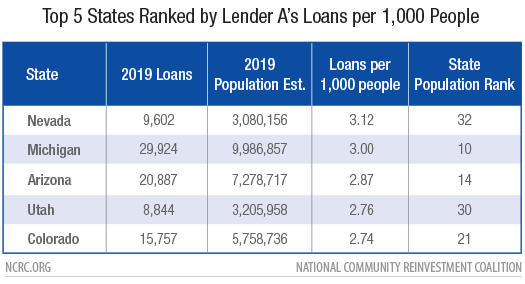
Table 5 above shows how a ranking based on loans per capita appears to achieve the objective of targeting branchless banks towards the smaller and less well-served states. Interestingly and importantly, Lender A, as an online lender, tends to have more presence in the smaller states than the larger states as measured by loans per one thousand people. This method elevates states with smaller populations to the top of the list. The top five in the table include Nevada, the 32nd largest state and Utah, the 30th.
The top twenty in Appendix Table 1 below also includes Wyoming at 50th and Vermont at 49th. Overall, the median state in the top 20 in Appendix Table 1 has a ranking of 20th in population size. In contrast, when ranking the top 20 states based on the total number of Lender A’s loans the median state had a ranking of 10th in population size.
Ordering states by loans per one thousand people does not neglect states with large populations. Large states like California and Florida still make the top 20 in Appendix Table 1. Michigan, the 10th largest state by population, also makes the cut in Table 5. Michigan is a good candidate for AAs because Michigan and its metropolitan areas have experienced high levels of disinvestment and deindustrialization.
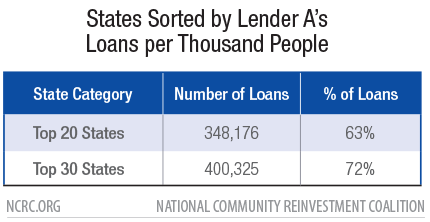
An ordering based on loans per thousand people would not only achieve the principle of robustness but would also achieve comprehensiveness. The top 20 states sorted by Lender A’s loans per thousand people in Table 5a below account for 348,176 loans or about 63% of the total Lender A’s lending in 2019. The top 30 states account for 400,325 loans or about 72% of the total. Thus, if a CRA exam chose AAs in 20 or 30 of the top states sorted by Lender A loans per thousand people, the exam would capture the great majority of loans.
Elevating Smaller States for Lender A’s AAs Can Still Accommodate Examining Most Loans in a Feasible Manner
Would achieving feasibility be possible after accomplishing robustness and comprehensiveness? If an examiner chose 30 states and two metropolitan areas as AAs and all rural counties in the state as the third AA, the exam would have 90 AAs. While this is a large number of AAs, Lender A was one of the largest mortgage originators in 2019 and thus should have a sizable exam to make sure it is lending equitably in communities. This is feasible for a lender the size of Lender A and when compared against the top 100 banks discussed above.
By way of comparison, consider a recent exam for one of the four largest banks. This bank had 248 AAs overall and 73 AAs that were full-scope in a recent CRA exam. As mentioned above, full-scope AAs had considerably more comprehensive exams than limited-scope AAs. The number of loans issued by this large bank in the most recent year on the exam was about 160,000 home mortgage loans and 445,000 small business loans. Combining the home and small business loan totals of this bank yields a number of loans comparable to Lender A’s.[16] Thus, the number of full-scope AAs of this large lender is comparable to the number of AAs our analysis suggests is feasible for Lender A. We are not endorsing a similar number of limited scope AAs for Lender A and discuss below whether to use limited scope AAs or adopt another approach.
It should also be noted that the CRA exam for this large bank states that the full-scope AAs were chosen based on population of the AA, which skewed full-scope AAs to the largest metropolitan areas in each state. The number of full-scope AAs ranged from two to four for each state. The exam also mentioned that some smaller AAs that were not full-scope on previous exams were selected as full-scope, but these were relatively few in number.[17] In contrast, this paper presents an approach for branchless banks, which appears to be better at identifying smaller states and metropolitan areas that are also underserved.
Other Methods Considered for Prioritizing States but Why this Paper Emphasizes Loans per Thousand People
Another method that could be used to designate AAs would be to employ market share. Under this approach, states could be sorted in descending order based on the percent of the market Lender A had. NCRC considered this approach and found that it also tends to elevate the smallest and underserved states but not quite to the same extent as loans per thousand people. A loan per capita ranking method for AA designation is a more direct way of measuring which states are underserved and determining if branchless banks are adept at serving those states. In addition, both loans per thousand people and market share could be used together to assign AAs to states.
Finally, this paper could have used loans per homeowners instead of loans per thousand people. We chose loans per thousand people to be consistent with the second case study below, but future analyses and investigations of loans per capital approach for selecting AAs should explore loans per homeowners.
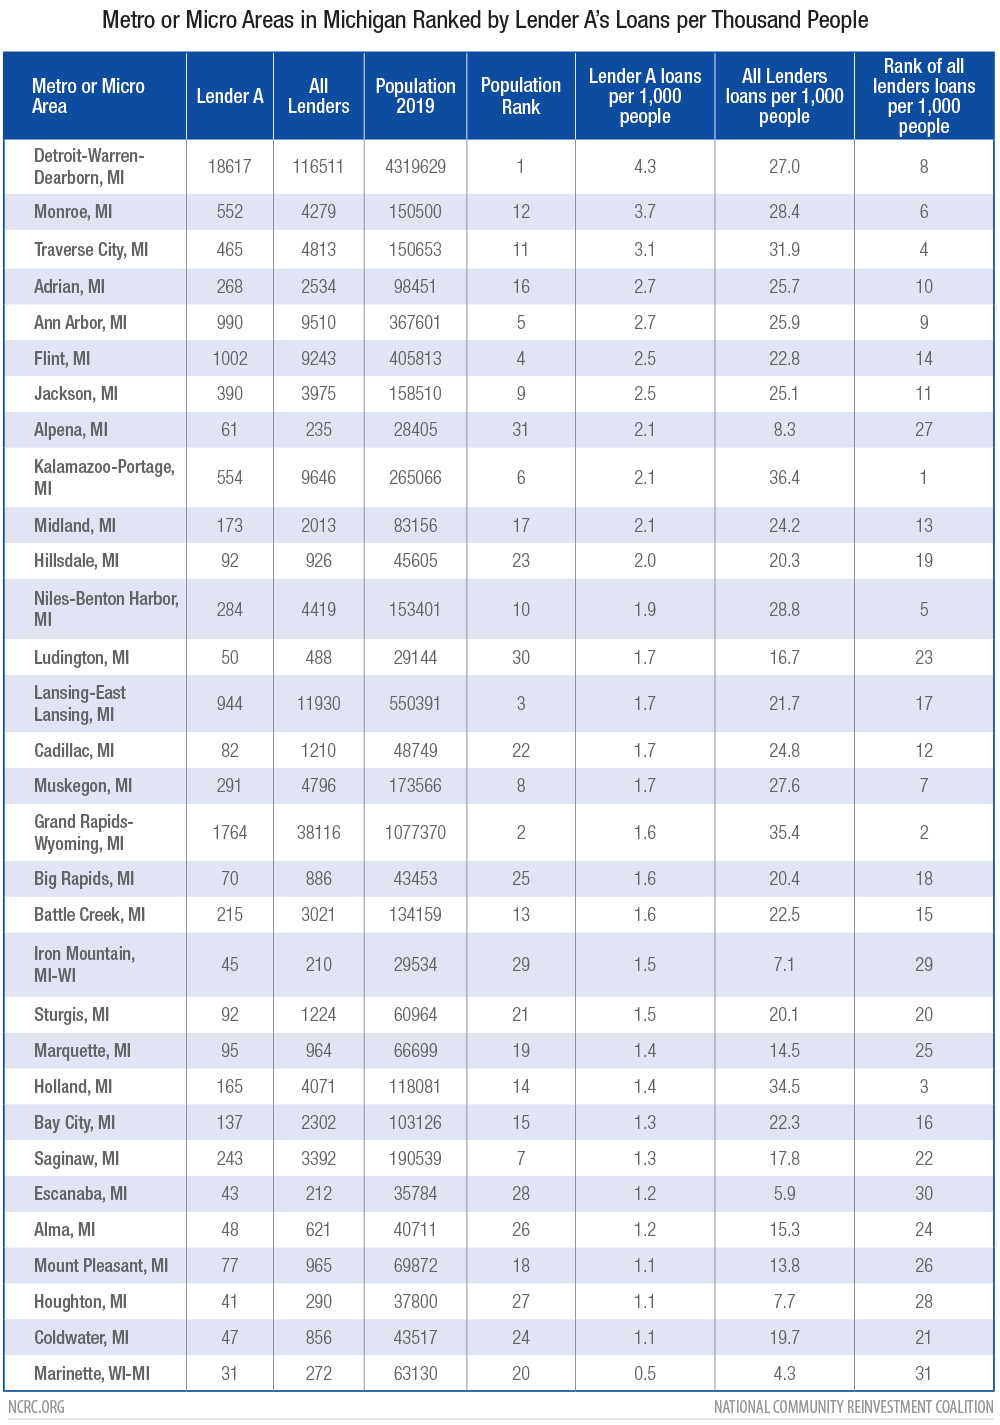
Lender A Loans by Metropolitan and Micropolitan Area in Michigan
Selecting states on a loan per capita basis appears to be workable for achieving the principles of robustness, comprehensiveness, transparency and feasibility. The next part of this case study of selecting metropolitan areas suggests that this approach would also work for selecting sub-areas within states. This study chooses Michigan and Arizona, the second and third state with the most Lender A loans per thousand people.
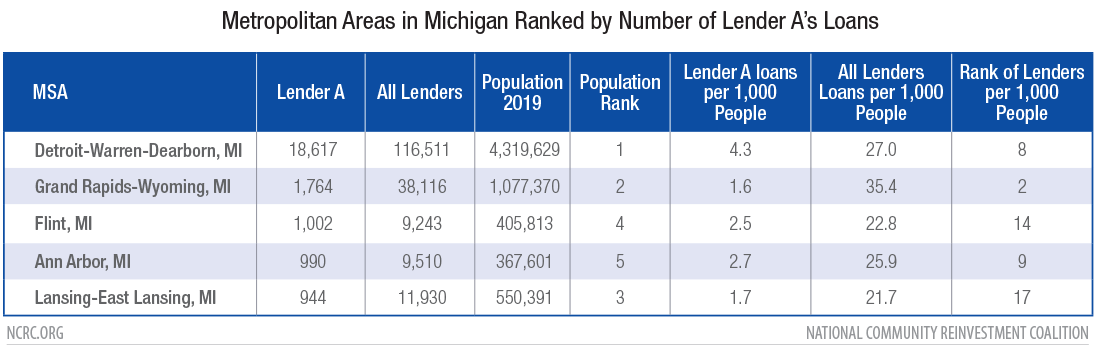
In the first state, Michigan, Lender A made loans in 31 metropolitan areas and micropolitan (generally less than 50,000 people) areas. When sorting these areas from largest to smallest number of Lender A loans, the first five areas selected are the five most populous areas in Michigan (Detroit, Grand Rapids, Lansing, Flint and Ann Arbor) as shown in Table 6.
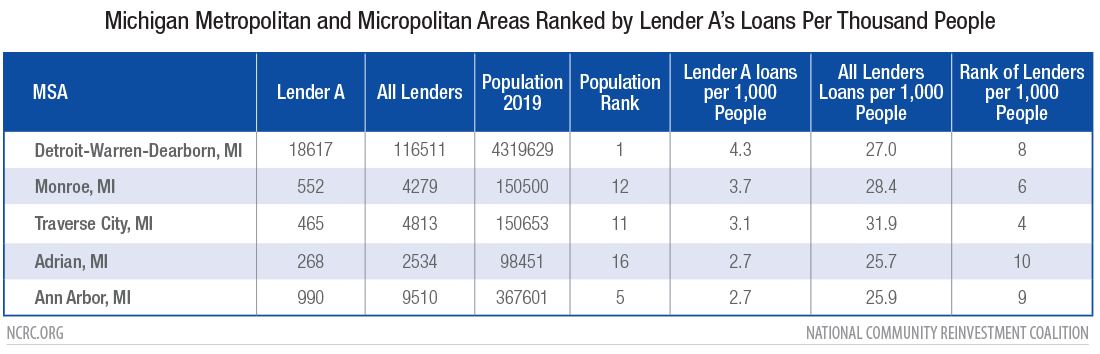
In contrast, if the areas are sorted by Lender A’s loans per 1,000 people, the five areas selected are not necessarily the largest, and they include more diversity. As shown in Table 7, the areas in descending order of Lender A’s loans per thousand people are: Detroit (most populous in the state), Monroe (12th most populous), Traverse City (11th most populous), Adrian (16th most populous) and Ann Arbor (5th most populous). While this list includes large metropolitan areas, it also includes others like Traverse and Adrian that are smaller than the top 10 metropolitan areas in the state. Appendix Table 2 shows all the areas ranked by Lender A’s loans per thousand people.[18]
As shown by this case study, using loans per thousand people for branchless lenders would help a CRA examiner identify AAs that are penetrated by these lenders and are not the best served overall or largest metropolitan areas in the state.
Lender A Loans by Metropolitan and Micropolitan Areas in Arizona
The second part of this case study, metropolitan and micropolitan areas in Arizona, suggests that sorting based on Lender A’s loans per thousand people also avoids a sole focus on the largest areas with the most aggregate (all lenders in the area) loans per thousand people. If the eleven areas in Arizona are ranked by the number of Lender A’s loans in descending order, the top five in Table 8 includes Phoenix, Tucson, Lake Havasu City, Prescott and Flagstaff. Except for Flagstaff, these areas are also the most populous. In addition, except for Flagstaff, they correspond to the areas with the most aggregate loans per thousand people.
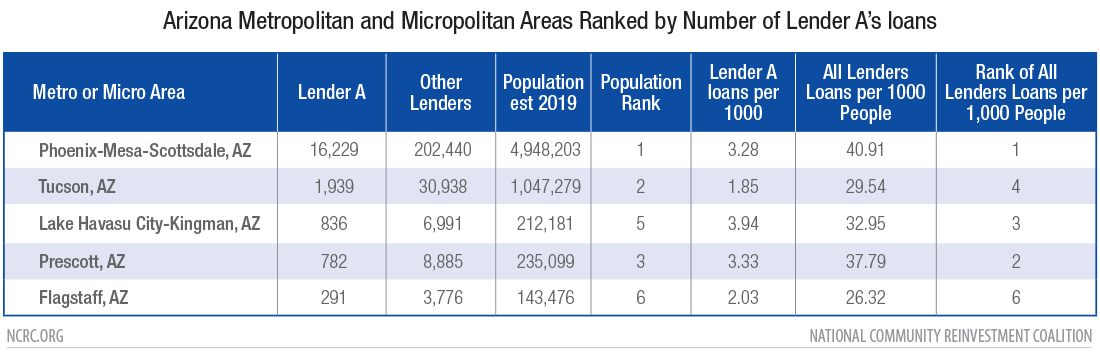
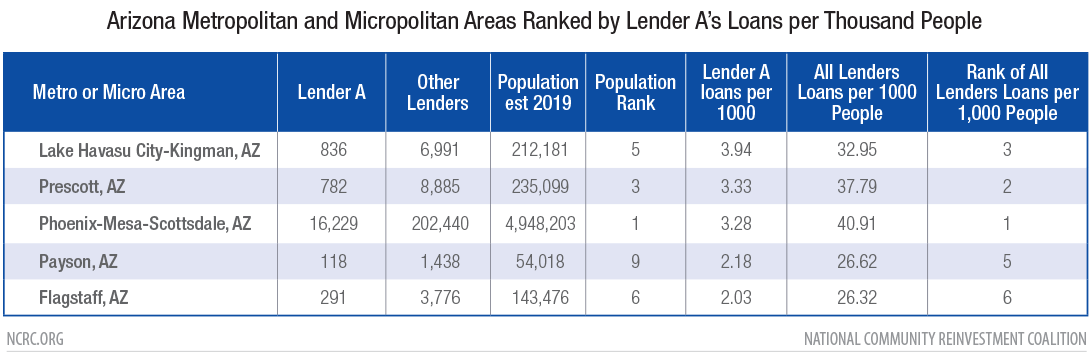
If the list is ordered by Lender A’s loans per thousand people in descending order, the top five on the list includes the same areas except that Payson is substituted for Tuscon (See Table 9 for the top five and Appendix 3 for all areas). Payson is one of the smallest areas, ranking ninth out of 11 areas in Arizona in terms of size.
In addition, Lake Havusu City is elevated in importance, holding the first position in contrast to Phoenix holding the first position when ranking by number of Lender A’s loans. In its ANPR, the board contemplates weighing AAs by the share of an institution’s loans and/or deposits in each assessment area. In contrast, a way to avoid the largest areas usually garnering the most weight is to also use loans per thousand people, at least for branchless lenders, as a factor for weighing.
In this case, Phoenix has 40.9 aggregate (all lenders’) loans per 1,000 people whereas Lake Havasu has 32.9 loans per 1,000 people. If Phoenix received the most weight on an exam for a large volume branchless lender like Lender A, the exam may reinforce disparities in aggregate lending per 1,000 people by focusing the branchless lender’s attention on Phoenix in contrast to Lake Havasu.
Like the Michigan case study, the Arizona case study shows that using Lender A’s loans per thousand people can help elevate the importance of smaller areas and help achieve the principle of robustness, that is, exams treating smaller areas more on par with larger ones.
Lender B Case Study Shows Sorting AAs by Consumer Loans per Capita Targets Underserved States and Areas
Lender B is a major online lender offering personal loans, small business loans and auto refinancing. Lender B allowed NCRC to use their data for purposes of this paper.
Table 10 shows lending by type and purpose during 2019. Debt consolidation, offered at 54.4%, was the most frequent purpose, followed by credit card refinancing at 26.9%. The third most frequent purpose was home improvement, which was used by borrowers 6.2% of the time.
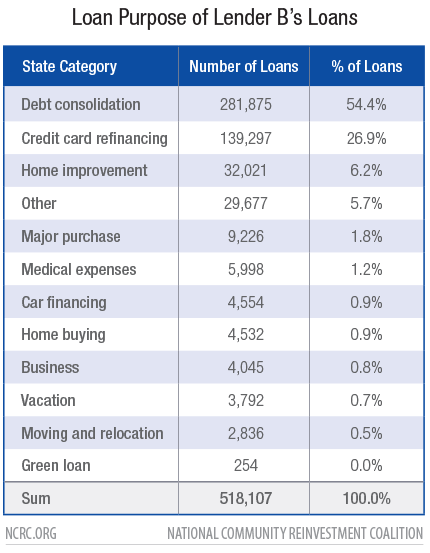
Note: Loans which lacked information on their purpose are not shown
Lender B’s Lending by State Sorted by Loan Volume
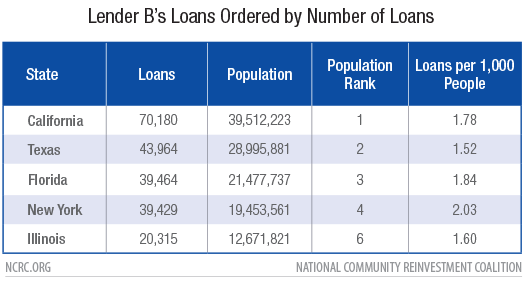
Except for Iowa, Lender B issued loans in every state during 2019 and had a sizable presence in most states. If Lender B’s loan volume is sorted in descending order by state for purposes of selecting AAs, Table 11 reveals that the top five states selected include the four most populous states and the sixth most populous state.
Selecting AAs with this emphasis may reinforce CRA oases and deserts by focusing exams on the most populous states. As shown above, the most populous states tend to have the highest aggregate home loans per thousand people. We cannot reproduce aggregate loans per thousand people for consumer lending because of a lack of industry wide data reporting, but it is not far-fetched that the patterns are similar to home lending with more market-wide penetration in the most populous states.
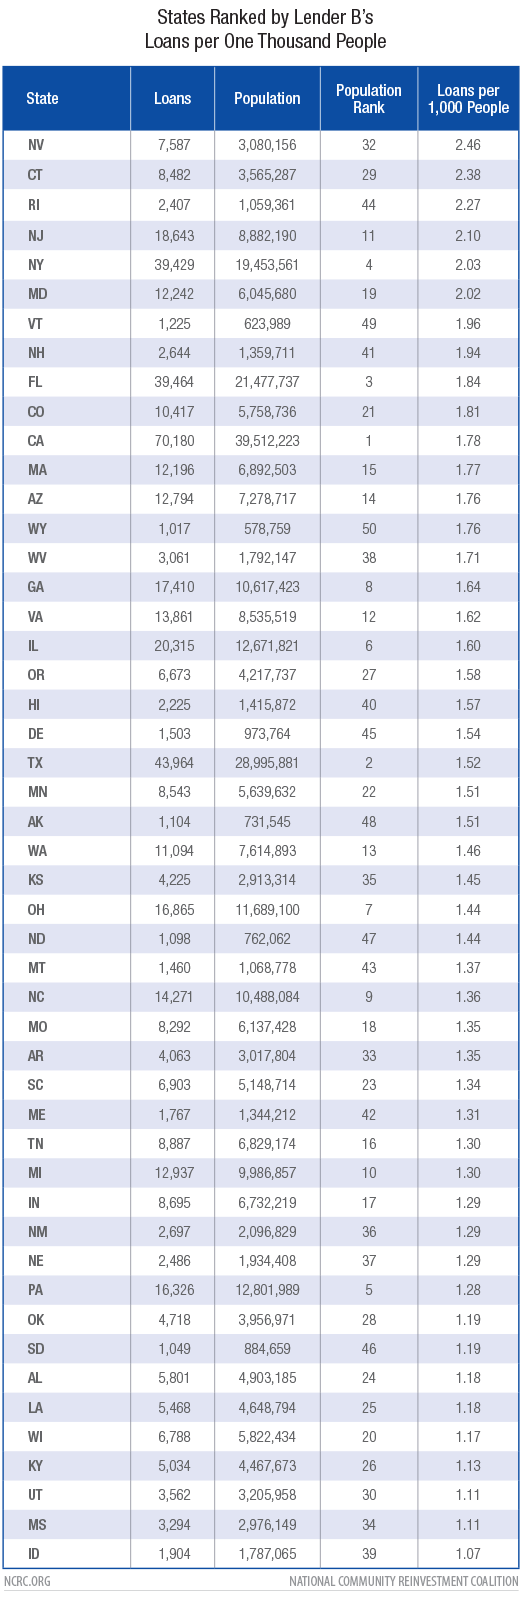
Lender B’s Lending by State Sorted by Loans Per Thousand People
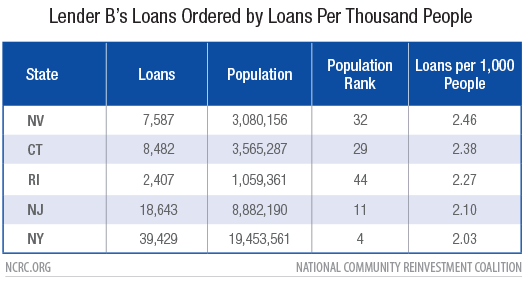
If states are selected for AAs based on Lender B loans per thousand people, smaller states are elevated in importance as shown in Table 12 (for top 5) and in Appendix Table 4 (for all states). Nevada, the 32ndlargest state in terms of population, has the most Lender B loans per 1,000 people (2.46 loans per 1,000 people). Connecticut, the 29th largest state, has the second most loans per thousand people followed by Rhode Island, the 44th largest state, at 2.27 loans per thousand people. The median population rank of the first ten states in Appendix Table 4 is 25th while the median rank of the second ten is 14th.
If CRA examiners choose to weigh AAs with a preference for Lender B’s market penetration as revealed by loans per thousand people, the smaller states would receive more weight instead of less, which is typical in CRA exams. CRA exams typically emphasize the larger states and metropolitan areas as these are the geographical areas in which large banks usually make most of their loans and receive most of their deposits. CRA exams often select AAs based on deposit and loan volume, leaving smaller states under-represented among AAs.The other virtue of this method is that it produces a diversity of population sizes and does not result in the neglect of large states. For example, New York, which is the fourth largest state, is in the fifth position on this list.
As well as achieving the principle of robustness (making sure a diversity of states receive rigorous exams), this method of choosing AAs achieves comprehensiveness. The top 25 states in Appendix Table 4 would have 71.3% of Lender B’s loans. Thus, the exam would effectively hold Lender B accountable for serving LMI borrowers and communities in states that constitute the great majority of its loans. Finally, the principles of transparency would be achieved if examiners presented an analysis in a manner similar to this paper. Feasibility is achieved since Lender B would have a number of AAs similar to other large lenders, if three or four AAs were selected for each state.
Lender B Loans by Metropolitan and Micropolitan Areas in Nevada
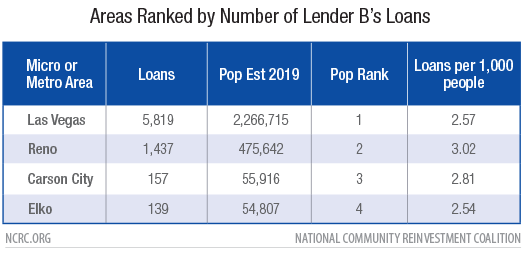
Since Lender B had a sizable presence in Nevada as measured by loans per thousand people, this paper further examines the lender’s presence in Nevada’s metropolitan and micropolitan areas. Lender B data included loans in the metropolitan areas of Las Vegas and Reno and in the micropolitan areas of Carson City and Elko.
When ranking areas by the number of Lender B loans, Table 13 shows that the areas are sorted from largest to smallest in population. The traditional method of weighing AAs on CRA exams would also result in the largest weights for the largest areas.
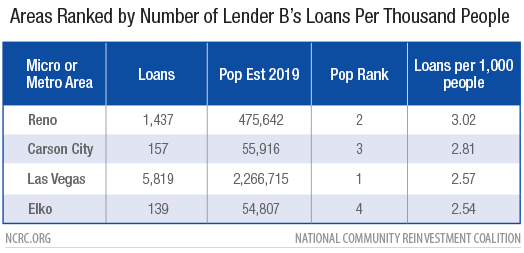
In contrast, Table 14 shows that if areas are sorted in descending order by number of Lender B loans per thousand people, a medium size metropolitan area, Reno, is the top ranked area followed by Carson City, a micropolitan area. If the patterns above for aggregate home lending are similar to results for aggregate consumer lending, these smaller areas are likely underserved by traditional lenders as shown above but are relatively well served by Lender B. It would make sense to either provide the most weight to Reno and Carson City as AAs on a CRA exam or at least provide equal weight to them as opposed to the traditional approach of weighing the larger areas the most.
Discussion
Consider Loans per Thousand People as a Method to Select AAs
These two case studies illustrate that it is not only feasible but desirable to assign state and local AAs to branchless banks that specialize in retail lending. The banking agencies should also consider a methodology that includes loans per thousand people for selecting state and local AAs. A methodology centered on loans per thousand people can achieve the principles of robustness, comprehensiveness, transparency and feasibility. One reason for this methodology’s applicability to branchless banks is that branchless banks appear to penetrate markets and smaller states that are not as well served by traditional lenders. Loans per thousand people for branchless banks and traditional lenders tend to be inverse in smaller states: lower loans per thousand people for traditional lenders than branchless lenders. In other words, this study shows for home lending, states with lowest per capita marketwide loans per thousand people tend to attract more branchless bank loans per thousand people.
Further research including qualitative studies should continue to assess the apparent inverse market presence of traditional lenders and branchless lenders. A previous board-sponsored study also showed this relationship for Lender B.[19] Perhaps consumers in areas with fewer traditional banks or bank branches will gravitate towards online loan options. However, this paper did not probe whether LMI consumers will do this to the same extent as non-LMI consumers. At the very least, it is important to establish CRA requirements in areas of market penetration by branchless banks to ensure that they are also serving LMI consumers.
This paper cannot claim that the method of using loans per thousand people is best suited to all branchless banks for all geographical areas and markets. In particular, this method should be tested for rural counties, which is not done by this paper (the elevation of the importance of micropolitan areas suggests this method might also do the same for rural counties). However, this method of loans per thousand people, which is not currently used by the bank agencies for selecting AAs, should be in the agencies’ toolbox because it can be particularly effective for some branchless banks and for some types of markets. The agencies should conduct more testing of this methodology for both branchless banks and traditional banks.
This methodology should also be considered as a method for weighing the importance of AAs in exams. As discussed above, the board is considering weighing AAs by the share of an institutions’ percentage of loans and/or deposits in each assessment area, which could reproduce the disproportionate weight of larger metropolitan areas on CRA exams. In contrast, even when loans per thousand people is not consistent in emphasizing smaller areas, it usually captures a diversity of areas and includes smaller areas in the top part of lists organized in descending order of loans per thousand people. Thus, a weighing that includes or emphasizes loans per thousand people holds promise at least in the case of branchless banks in elevating the importance of relatively underserved areas.
In contrast, the use of national AAs for retail branchless banks would be a disservice for smaller metropolitan areas and rural counties. It does not seem possible that a national assessment area as mentioned by the Board as a possibility for non-traditional lenders could as effectively lift up the smaller metropolitan areas as shown by these case studies.
Methods for Using Several AAs but Shortening and Better Focusing CRA Exams
The number of AAs should be carefully considered. The lenders in these case studies are large lenders. As such, it seems feasible and desirable to require them to have 100 or more AAs. However, how would this translate in terms of the degree of difficulty for CRA examiners in conducting exams? The exams of the very largest traditional banks seem to take an inordinately long time, in part because of the analysis required to assess CRA in several AAs. As a result, the CRA exams of the largest banks can be as infrequent as once every five years or longer as documented in previous NCRC research. However, it is not clear that this is due to the large number of AAs. The current exams have a mind-numbing narrative that consumes literally hundreds of pages. It seems as if examiners are instructed to talk about every row and column in hundreds of tables. Even some of the paragraphs seem to be cut and paste jobs, substituting a couple of numbers when necessary.
Retail lending analysis can be conducted in a more succinct manner even across several AAs. The board proposes the use of more consistent thresholds and scales that can effectively differentiate AAs into different ratings that more clearly capture differences in retail lending performance. Exam narrative can then discuss areas in which the lender is performing particularly well or poorly and probe the reasons for this. That type of narrative can be more informative for both lenders and community organizations.
How to Consider Lending in Parts of States Not Designated as AAs
If a judgment is made that the number of AAs should be reduced, one option as discussed above is to choose two or three metropolitan areas for each state and then group all rural counties together in which the lender is active. These areas would receive robust analysis. However, the other areas in which a lender has a large presence would receive less attention. To compensate for this, the areas designated for AAs could rotate during successive exams, which could be conducted more frequently.
Another option would be that for areas not designated as AAs, retail lending could be considered on a statewide level. In other words, the rest of the state would be designated as one more assessment area and would receive its own rating. For example, suppose a state had four AAs (three metro areas and a statewide rural area). These four AAs would each receive ratings for CRA performance. Then a fifth rating would be assigned which would consider activity in the rest of the state. The five ratings would then be weighed to develop a statewide rating.
The advantage of adding a rating for performance in the rest of the state for retail lending is that it would complement the method the board is considering for the community development test. The board is considering a statewide rating for community development that would capture community development activities not in AAs. This is quite similar to the notion of considering retail lending that is not in AAs.
The downside of grouping retail lending not in AAs in a category “rest of the state” is that demographic characteristics and economic conditions can differ greatly in areas in the “rest of the state.” Aggregating to the “rest of state” can therefore produce performance measures that are not as meaningful as if they were local performance measures. The same difficulty presents itself when considering community development in the “rest of the state.”
Given the difficulties in blending performance in the rest of the state, it would be advantageous to have more, rather than fewer AAs, at least for retail lending. Alternatively, the agencies could reduce the number of areas but rotate them in more frequent exams. Overall, deciding on optimal mixes of local and statewide areas is a careful balancing act among the principles of robustness, comprehensiveness, feasibility and transparency. The agencies should carefully explain their final choices and rationale to the public.
Conclusion
This paper has provided a key insight that a new methodology of selecting AAs focusing on loans per thousand people seems to work well in the case of branchless banks by capturing the inverse market positions of some branchless banks and traditional lenders in less populated states and areas.
Discussing the importance of assessment area selection, the paper shows how traditional approaches focusing on the percentage of banks’ deposits across areas could end up reproducing CRA deserts and oases. Instead, AA selection should be based on methodologies that aim to achieve the principles of robustness, comprehensiveness, transparency and feasibility. This would be the best way to achieve equitable and efficient CRA exams.
Methodology
The data for 2019 population was obtained from the Census Bureau.[20] The Home Mortgage Disclosure Act (HMDA) data analysis in this paper used all single-family loans financing homes that were site built.
Lender B provided NCRC with data for the research purposes associated with this paper. Lender B data had three-digit zip codes for loan location, which are not optimal sorting devices for assigning loans into metropolitan or micropolitan areas. NCRC investigated a few states as candidates for further analysis on a metropolitan or micropolitan level, but our level of confidence was higher in the reliability of assignments of loans into metropolitan or micropolitan areas in Nevada. It is not clear in some cases which metropolitan or micropolitan area is the target area for a three-digit zip code. In the Nevada case study, this seemed to be an issue only for Carson City but a relatively small number of loans, 157, are possibly miss-assigned.[21]
Appendix Tables

[1] Federal Reserve Board, Advanced Notice of Proposed Rulemaking (ANPR), Community Reinvestment Act Regulation BB Docket No. R-1723, RIN 7100-AF94, Federal Register, Vol. 85, No. 202, Monday, October 19, 2020, Proposed Rules, p. 66417, https://www.federalreserve.gov/aboutthefed/boardmeetings/files/cra-fr-notice-20200921.pdf
[2] Lei Ding and Leonard Nakamura, Don’t Know What You Got Till It’s Gone: The Effects of the Community Reinvestment Act (CRA) on Mortgage Lending in the Philadelphia Market, Working Paper No. 17-15, June 19, 2017, https://www.philadelphiafed.org/-/media/research-and-data/publications/working-papers/2017/wp17-15.pdf and Lei Ding, Raphael Bostic, and Hyojung Lee, Effects of the CRA on Small Business Lending, Federal Reserve Bank of Philadelphia, WP 18-27, December 2018, https://www.philadelphiafed.org/-/media/research-and-data/publications/working-papers/2018/wp18-27.pdf.
[3] Federal Reserve System, Advanced Notice of Proposed Rulemaking, Community Reinvestment Act, Federal Register, Vol. 85, No. 202, Monday, October 19, 2020, Proposed Rules, p. 66418.
[4] Federal Reserve System, ANPR, p. 66418.
[5] Examples of non-traditional banks headquartered in Salt Lake City with a national presence that had strategic plans or were examined as wholesale and limited purpose banks include BMW Bank of North America, Celtic Bank, Medallion Bank, Sallie Mae Bank, Webbank, Continental Bank, Enerbank USA, UBS Bank USA, Optum Bank, Inc., The Pitney Bowes Bank, Inc., American Express National Bank, Marlin Business Bank, Comenity Capital Bank. See https://www.ffiec.gov/craratings/default.aspx to search for bank CRA exams.
[6] The consideration of lending outside of AAs is described in Q&A § __ .22(b)(2) & (3)—4, see Federal Register, Vol. 81, No. 142, Monday, July 25, 2016, page 48538. The OCC reiterated this procedure in a recent bulletin, https://www.occ.gov/news-issuances/bulletins/2018/bulletin-2018-17.html#ft6.
[7] Ibid.
[8] OTS 2009 Citicorp CRA exam, see http://www.occ.gov/static/cra/craeval/OTS/CRAE_14470_20091109_64.pdf.
[9] OTS 2005 Capital One CRA exam, see http://www.occ.gov/static/cra/craeval/OTS/CRAE_13181_20050718_64.pdf.
[10] OCC 2016 CRA exam of Bank of the Internet, https://www.occ.gov/static/cra/craeval/nov16/716456.pdf.
[11] Bank of Internet exam, p. 11.
[12] Bank of Internet exam, p. 7.
[13] Bank of Internet exam, p. 1.
[14] Bruce Mitchell, PhD, Proposed OCC and FDIC Geographic Analysis of Home and Small Business Lending: Permission to Decrease Lending for the Largest Banks?, March 2020, https://ncrc.org/proposed-occ-and-fdic-geographic-analysis-of-home-mortgage-and-small-business-lending-permission-to-decrease-lending-for-the-largest-banks/.
[15] Board ANPR, p. 66455.
[16] Two other large bank exams had the following number of AAs – JP Morgan Chase, 2013, OCC Exam had 209 AAs and 32 full-scope AAs, https://www.occ.gov/static/cra/craeval/jul18/8.pdf, and Wells Fargo’s 2019, OCC exam had 216 AAs and about 700,000 home loan originations and purchases in 2018. https://www.occ.gov/static/cra/craeval/Jun20/1.pdf
[17] OCC 2018 exam of Bank of America, pp. 10-11, https://www.occ.gov/static/cra/craeval/oct19/13044.pdf
[18] In addition, the top five areas on Table 7 are between the 4th and 10th highest in terms of aggregate loans (all lenders) per 1,000 people. Expanding this list to the top 10 in terms of Lender A’s loans per thousand people includes areas that are below the top 10 in terms of aggregate loans per thousand people.
[19] Julapa Jagtiani and Catharine Lemieux, Working Paper No. 17-17: Fintech Lending: Financial Inclusion, Risk Pricing, and Alternative Information, Federal Reserve Bank of Philadelphia, July 2017, https://www.philadelphiafed.org/-/media/research-and-data/publications/working-papers/2017/wp17-17.pdf. The study says, “More than 75 percent of newly originated loans in 2014 and 2015 were in the areas where bank branches declined in the local market” on p. 22.” We found that Lender B’s consumer lending activities have penetrated into areas that could benefit from additional credit supply, such as in areas that lose bank branches and in highly concentrated banking markets.”, p. 35.
[20] The United States Census Bureau, Metropolitan and Micropolitan Statistical Areas Population Totals and Components of Change: 2010-2019, https://www.census.gov/data/tables/time-series/demo/popest/2010s-total-metro-and-micro-statistical-areas.html
[21] For three digit zip code locations, see https://pe.usps.com/Archive/HTML/DMMArchive20050106/print/L002.htm
