fbpx
Photo of closed business

NCRC Paycheck Protection Plan Preliminary Analysis

The government’s flawed COVID relief program underscored the need for equity in small business financing, and for stronger enforcement of fair lending laws. 

On December 1, the Treasury Department made available the detailed loan records of all 5 million borrowers that took loans under the Small Business Administration’s (SBA) Paycheck Protection Program (PPP). Since the program debuted earlier this year, NCRC tested lenders and studied the data previously released by the administration. These reports concluded that business owners of color likely faced discrimination and more difficulty getting a PPP loan than White applicants, but that the data released by the Treasury Department did not allow for a loan-level analysis.

Several news organizations sought the full and unedited data from the SBA by suing under the Freedom of Information Act (FOIA). Despite attempts by the SBA to keep the details of these publicly backed loans a secret, the federal judge in the case noted that in the application they fill out, PPP borrowers acknowledge that the loan data is public data, and some will be released to researchers.

The SBA chose to release this data without adding the latitude and longitude of the addresses, a process called geocoding. NCRC used a commercial service, Geocodio, to geocode this data.

All 5 million loan records released by the SBA were geocoded, using the address provided by the borrower. The results of the geocode process are noted in the table below. Our preliminary analysis  showed that the highest-income areas received a significantly greater number and dollar amount of the PPP loans than low-income areas.[1] After adjusting the data for the number of businesses in each neighborhood, we found that on average, neighborhoods in low-income areas received less than a quarter as many PPP loans (.387 loans in low-, compared to 1.787 loans in upper-income census tracts), and only about one-third of the PPP loan amount ($36,481 per business in low- and $100,539 in upper-income census tracts.) Additionally, our analysis showed that neighborhoods with higher percentages of people of color received significantly fewer loans and lower amounts.

Geocode Results by Accuracy
NCRC has geocoded the entire file of PPP loan data with a high degree of accuracy for most loans. Contact NCRC for information on how to access this data.

The release of this data is a positive step and we are encouraged by its publication. At this time, there is very little known about lending to businesses in the U.S. The Consumer Financial Protection Bureau (CFPB) is beginning to implement Section 1071 of the Dodd-Frank Act, a provision that will require lenders to report applications for loans made to businesses. These data will provide lenders, regulators and the public a much clearer understanding of which businesses have been able to access credit to expand. 

In the meantime, the PPP loan data offers a unique opportunity for researchers that NCRC would like to support. To that end, NCRC will make the full geocoded data for these loans available to our members or media organizations. These data will be provided without representations or warranties. Members should contact jedlebi@ncrc.org for more information, while media organizations should contact awiltse@ncrc.org.

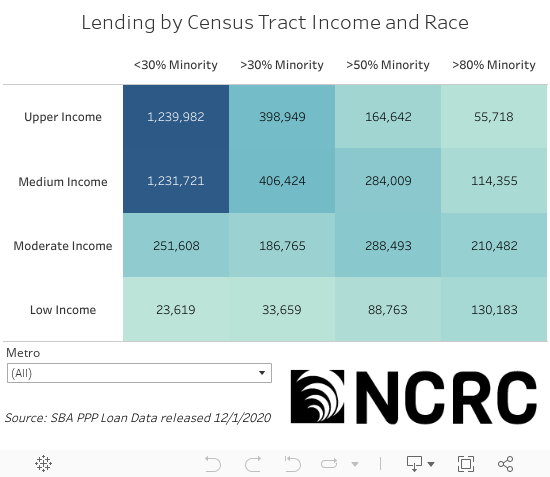
Analysis of previously released PPP data as well as stories from NCRC member organizations and our own mystery shopper testing suggested that businesses owned by people of color or located in lower-income neighborhoods and communities of color were less likely to get a PPP loan. In this preliminary analysis, a clear pattern emerged of greater investment in upper- and middle-income census tracts with a low percentage of loans in lower-income or majority minority census tracts.

Number of loans made by income and minority status.

Research using PPP data is complicated by several factors. While PPP loans were theoretically available to most businesses with some limited restrictions, there were preferences for some industries and business types. Furthermore, it is widely reported that many lenders would only offer PPP loans to existing customers. Many businesses are located in commercial areas, and as such the race and income of the limited population in those census tracts may be a poor indicator of the impact of these loans. It is also impossible to tell from this data if the loan was made to a commercial or residential location, and if the impact of the loan was in fact felt in that census tract or not.

Many lenders took part in the PPP lending program, and the top lenders range from large banks to smaller institutions to fintechs offering loans online. In each community, a different mixture of lenders were among the top. The number of low- and moderate-income census tracts varies across the country. Using the tool below, you can see how well the top lenders were at making loans in LMI neighborhoods in your community.

Top lenders and the percentage of loans they made in each census tract by income.

The $500 billion handed out to businesses under the Paycheck Protection Program was an effort to support workers and protect the economy, but in its rush to support the Americans hardest hit by the pandemic the PPP program may have left out traditionally underserved communities. The large gap in the number and amount of PPP loans to low-income areas compared to upper-income areas shows that there were stark differences in the allocation of capital to small businesses at a time of national crisis. This data is not just a starting point for understanding who was left out of the PPP program, but it will also help guide any future programs that the Biden Administration might offer to help protect businesses and employees and get America back to work after this pandemic is over.

Jason Richardson, Director, Research & Evaluation, NCRC
Bruce C. Mitchell, PhD, Senior Research Analyst, NCRC
Jad Edlebi, GIS Specialist, Research, NCRC


[1] Based on a national level analysis of variance test (ANOVA) of lending to FFIEC classified low, moderate, middle, and upper income census tracts.

Photo credit: ©vivalapenler – stock.adobe.com

Print Friendly, PDF & Email
Scroll to Top