Selective Ablation of Dehydrodolichyl Diphosphate Synthase in Murine Retinal Pigment Epithelium (RPE) Causes RPE Atrophy and Retinal Degeneration

 , and
, and 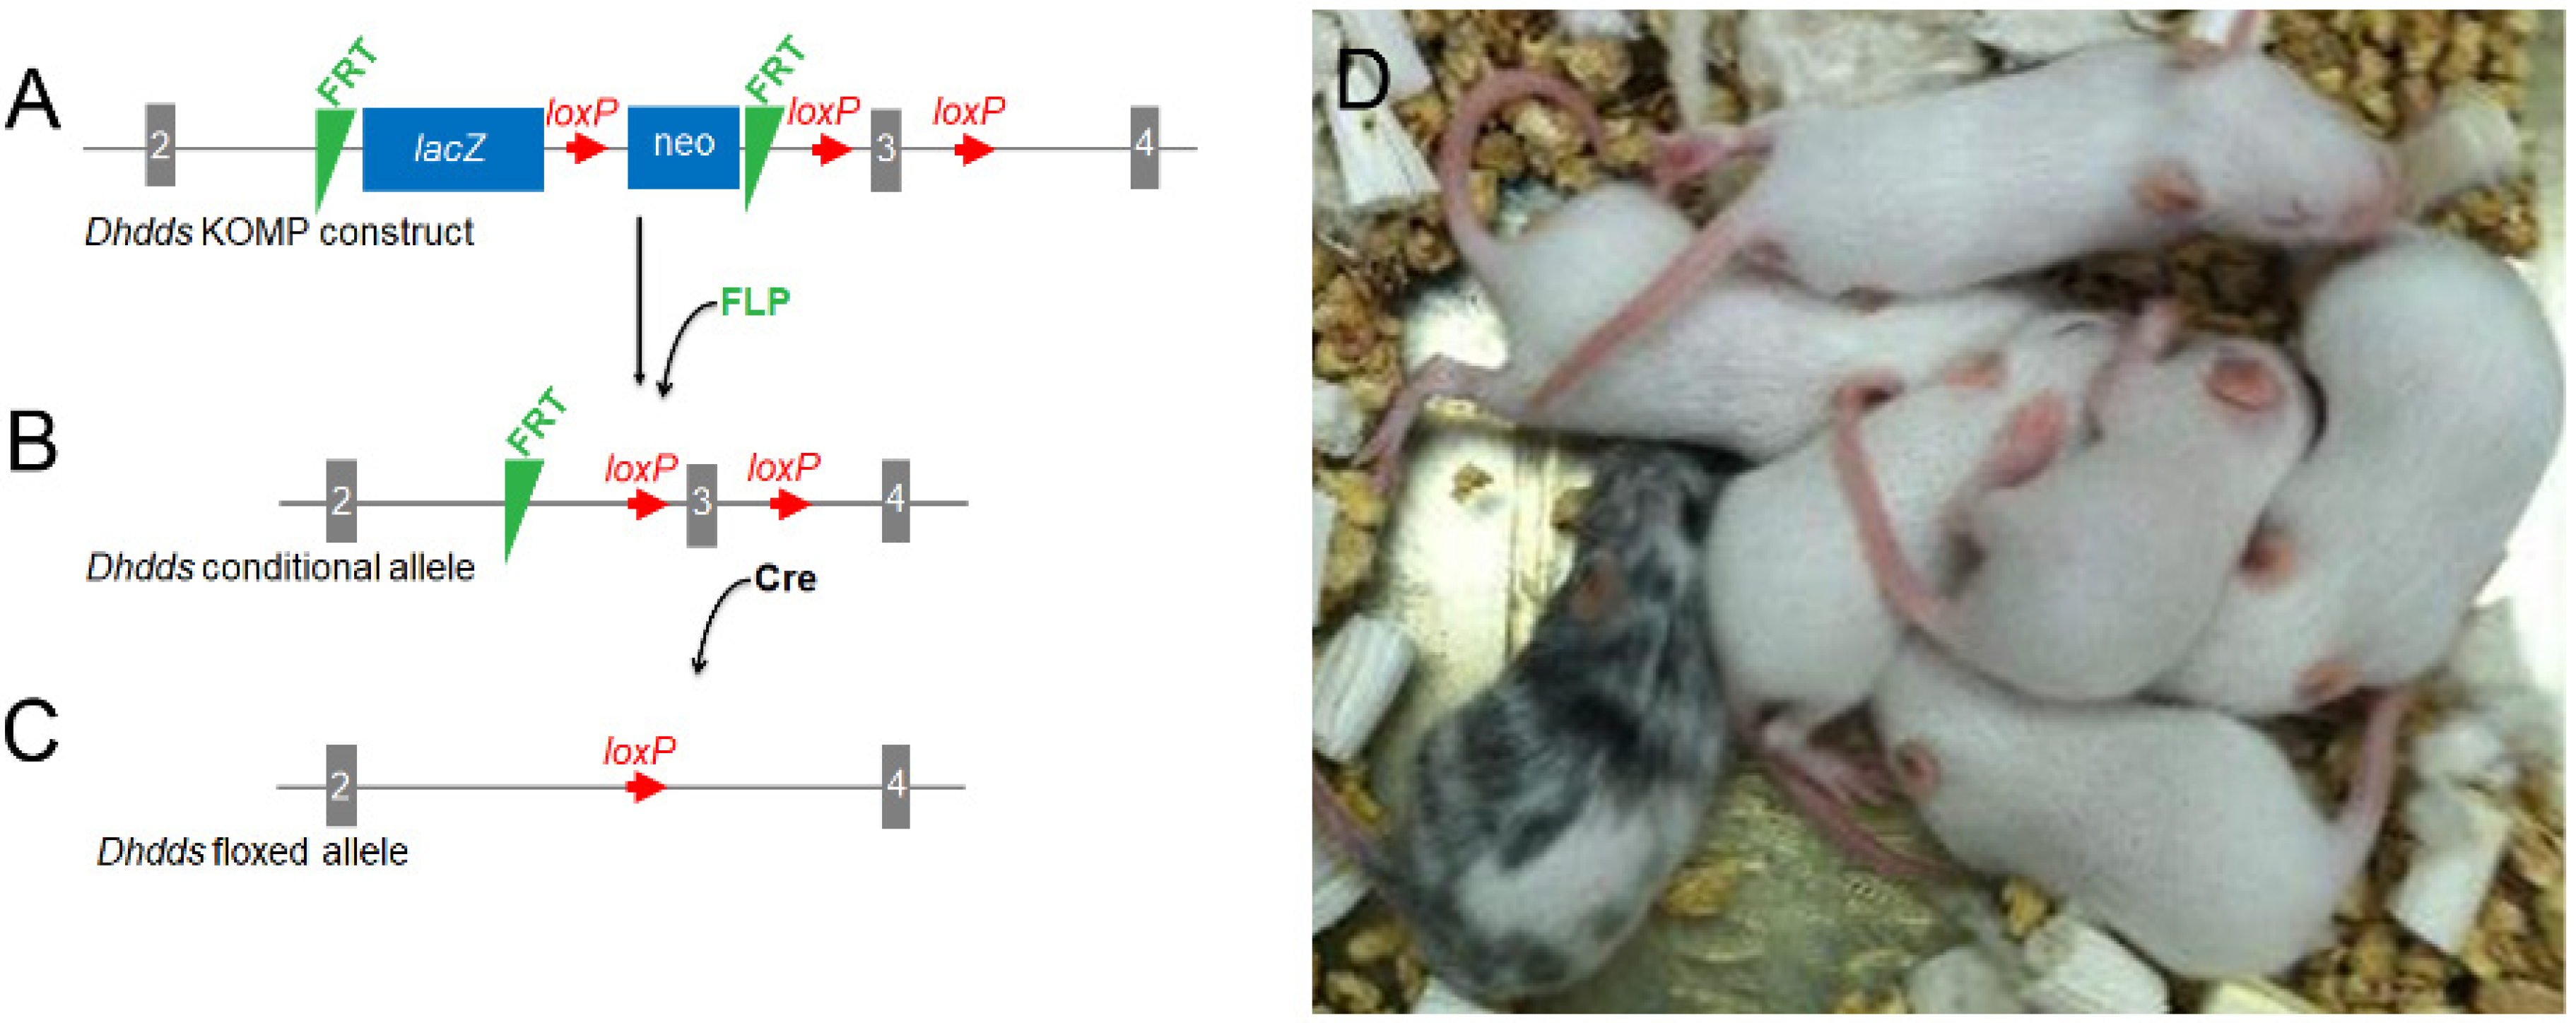
Abstract
:1. Introduction
2. Materials and Methods
2.1. Generation of Dhddsflx/flx CreRPE Mice
2.2. PCR Genotyping
2.3. Spectral-Domain Optical Coherence Tomography
2.4. Fundus Examination and Fluorescein Angiography
2.5. Visual Function Testing
2.6. Histology/Immunohistochemistry
2.7. Fluorescein Angiography
2.8. Electron Microscopy
2.9. Serial Block-Face Scanning Electron Microscopy (SBF-SEM)
2.10. Statistical Analysis
3. Results
3.1. Generation of a Floxed Dhdds Mouse Line
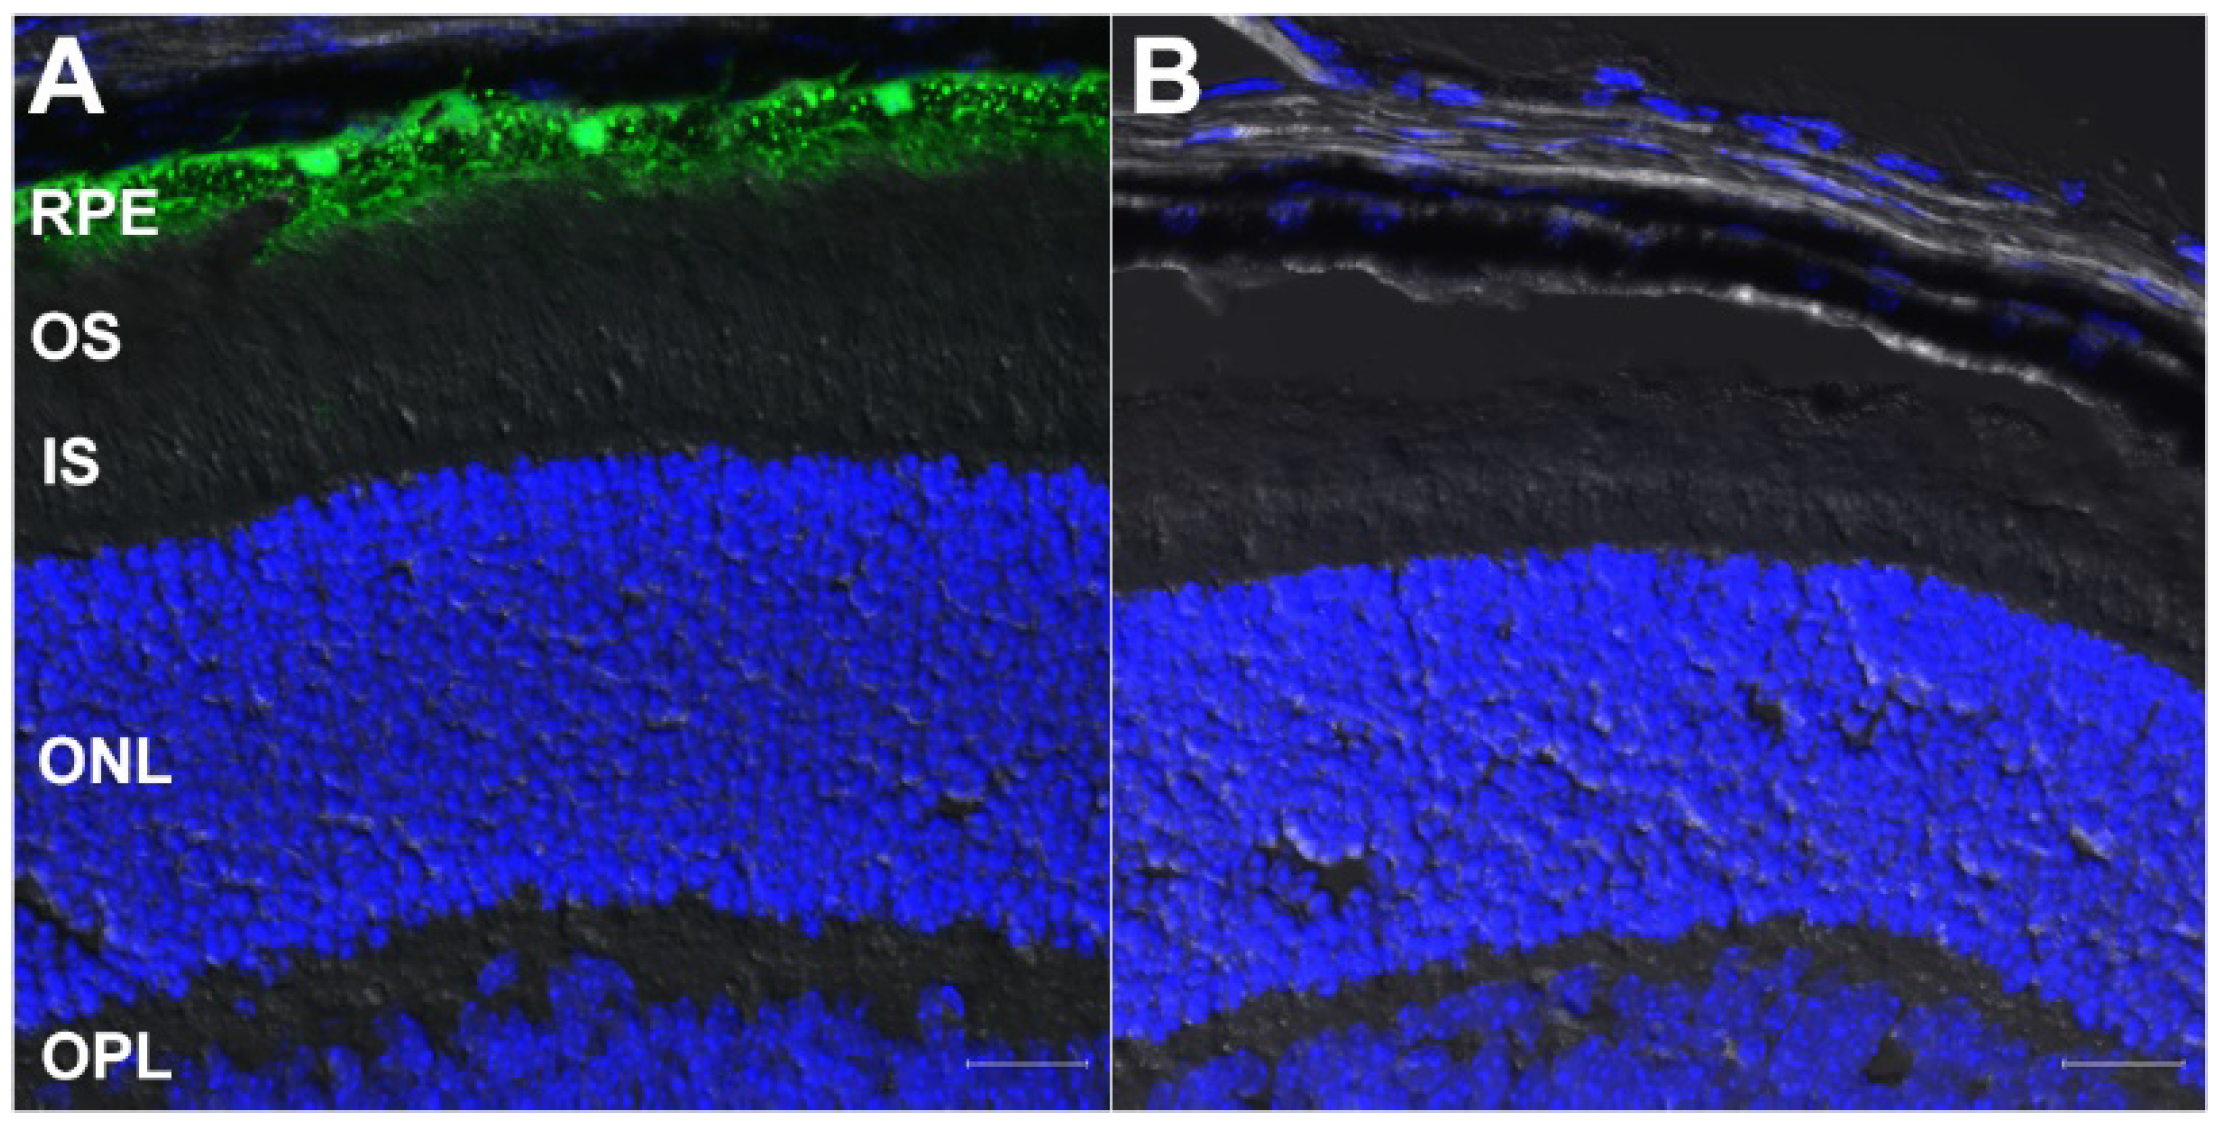
3.2. Validation of Retinal Cell Type-Specific Cre-Expressing Mouse Lines
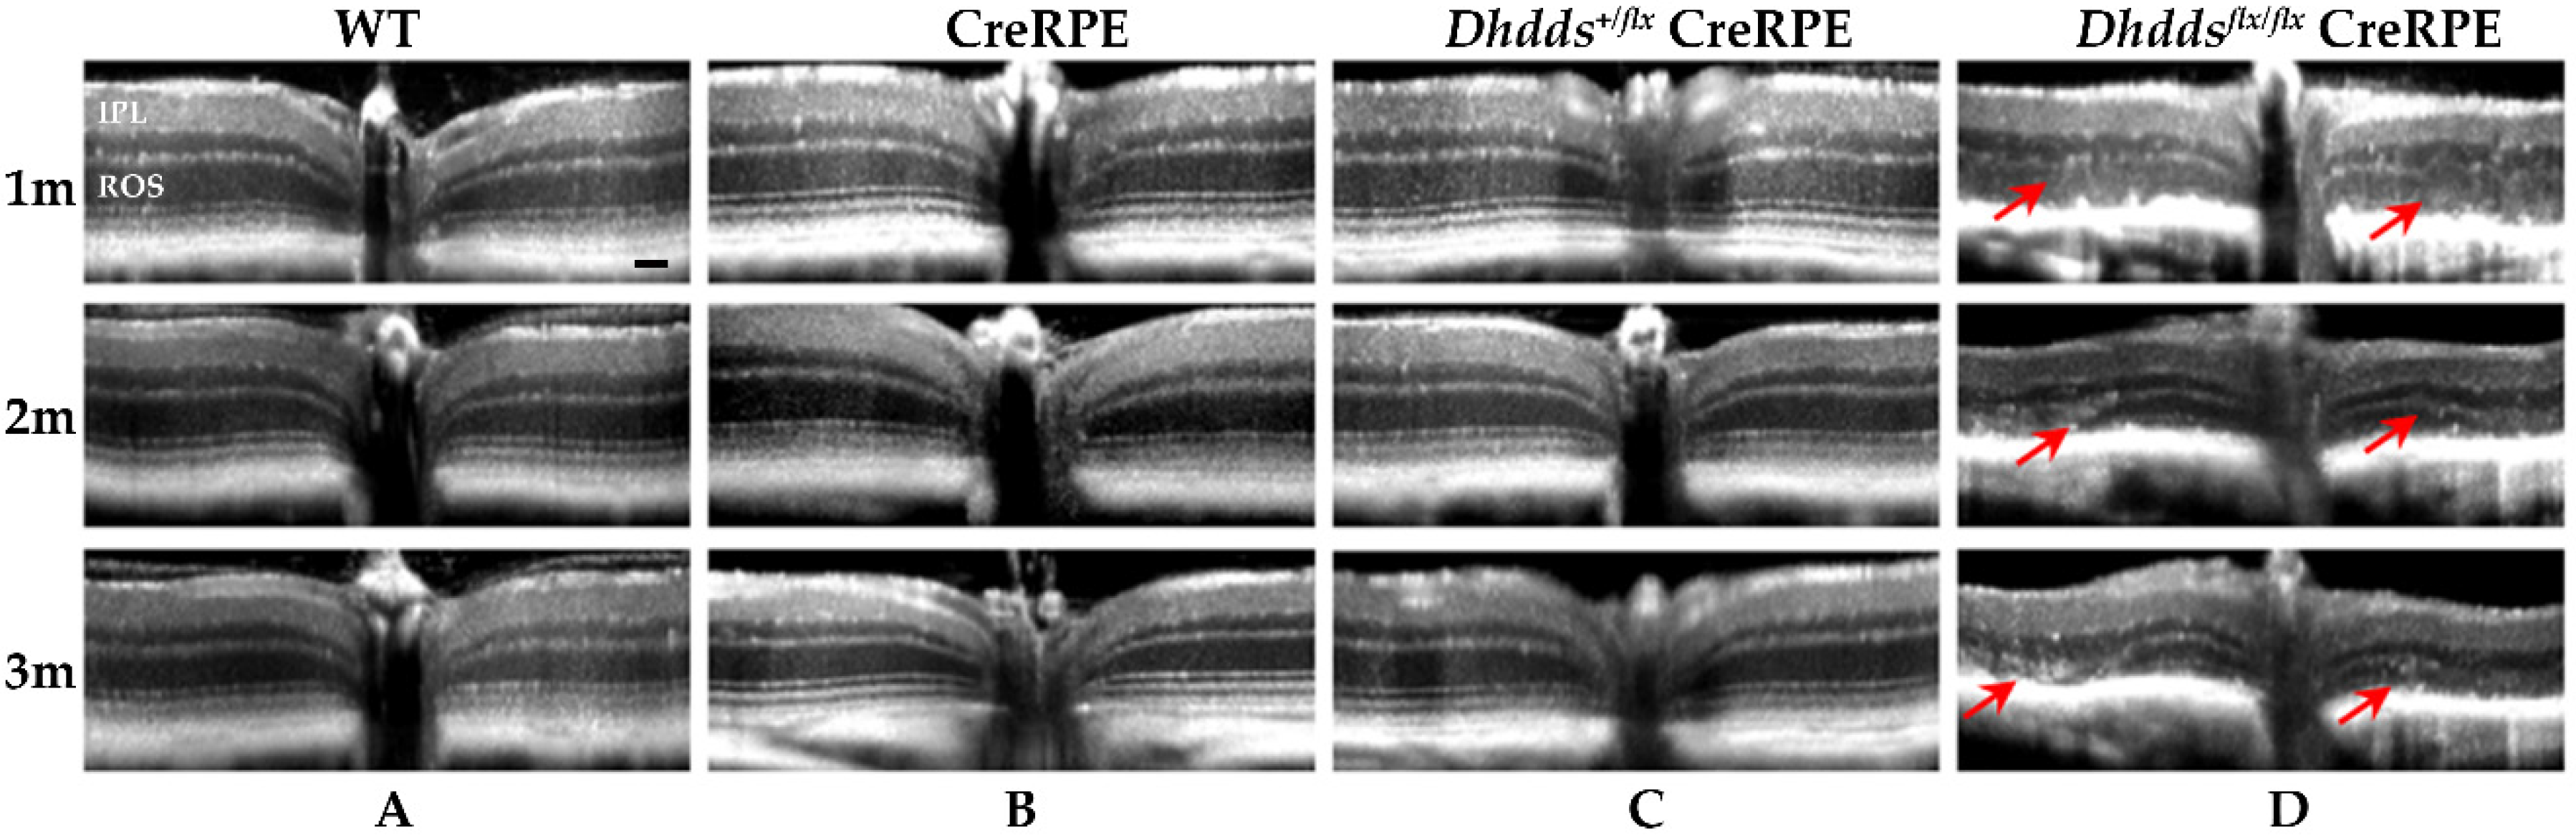
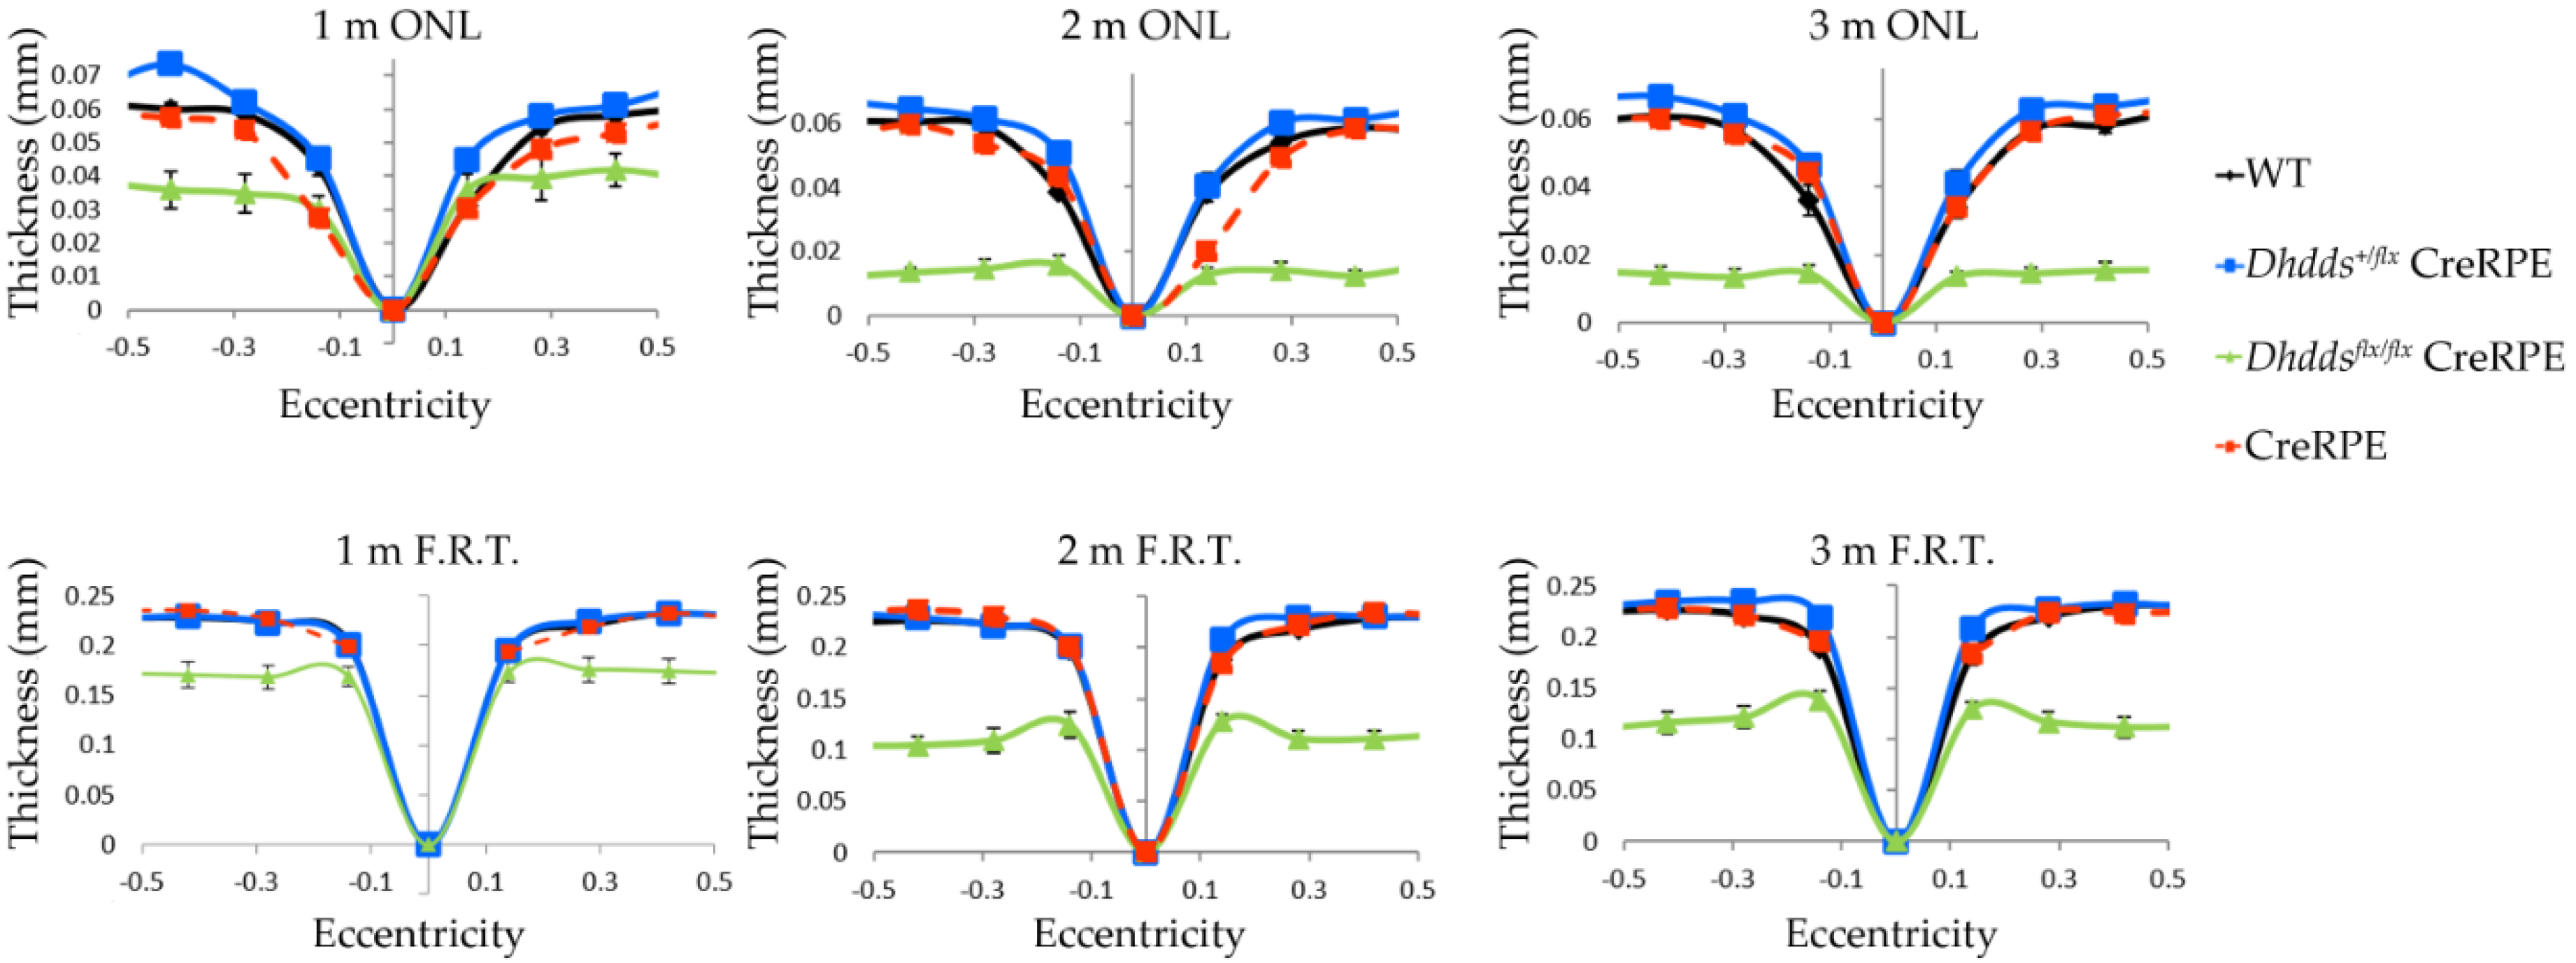
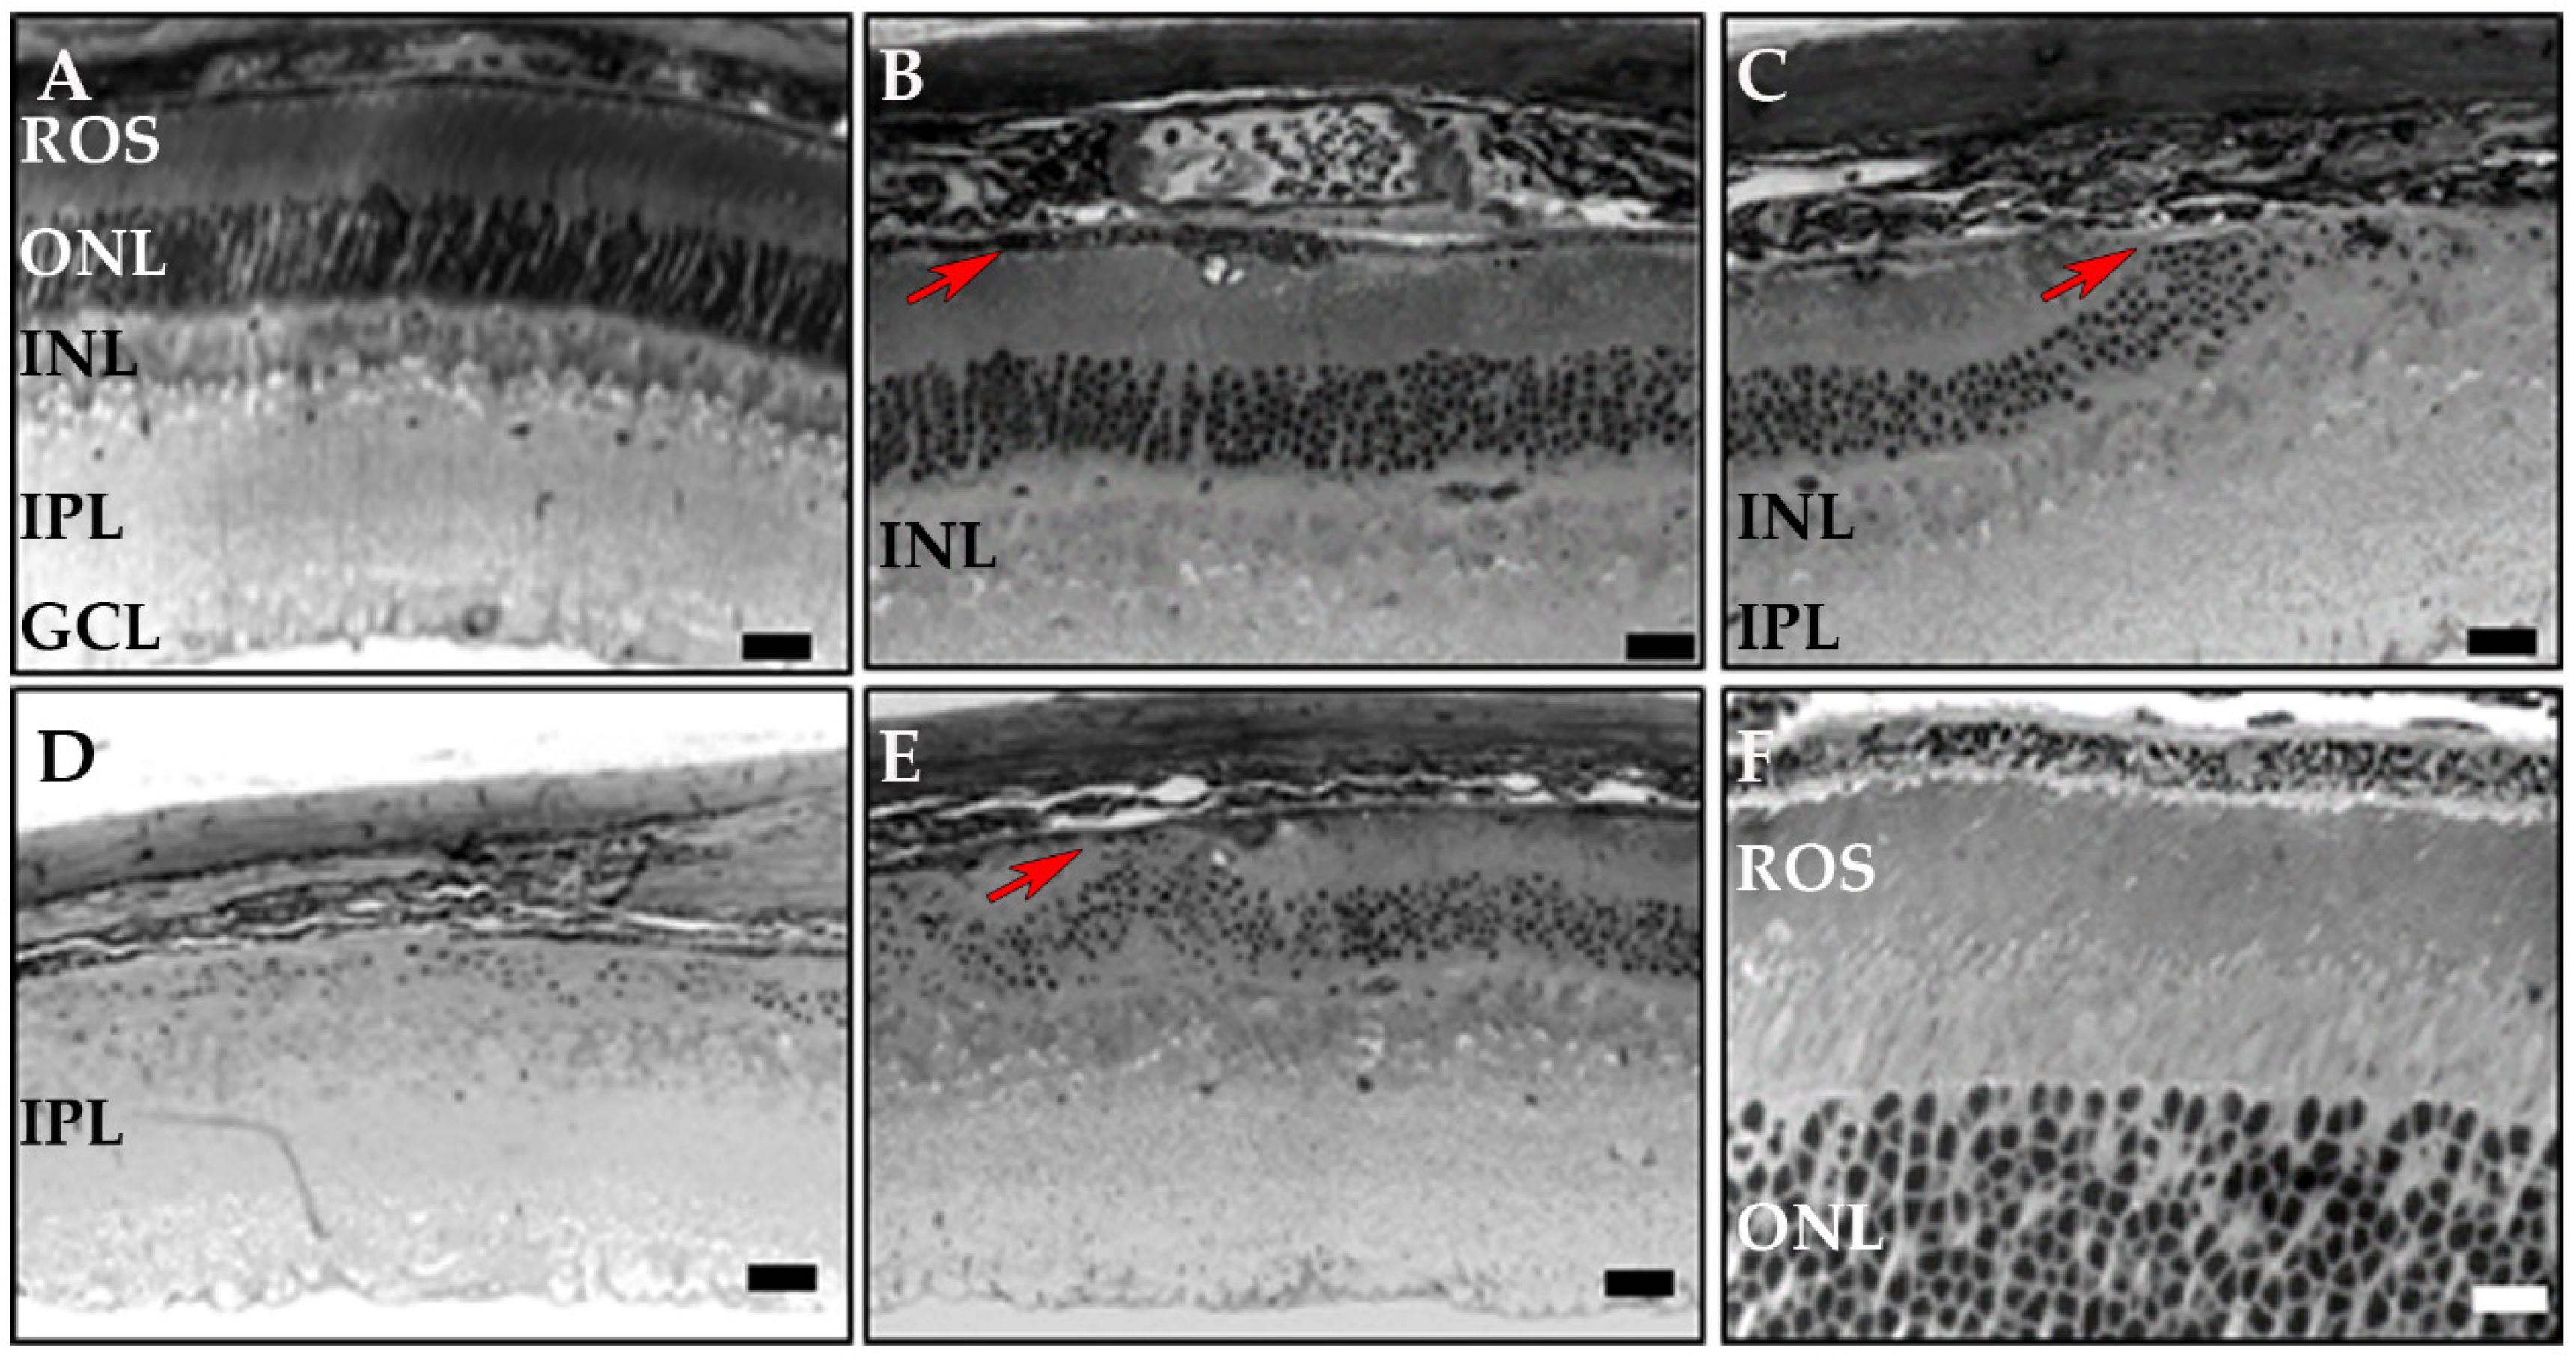
3.3. RPE-Specific Ablation of Dhdds Causes a Geographic Atrophy-Like Phenotype and Retinal Degeneration, Involving Photoreceptors
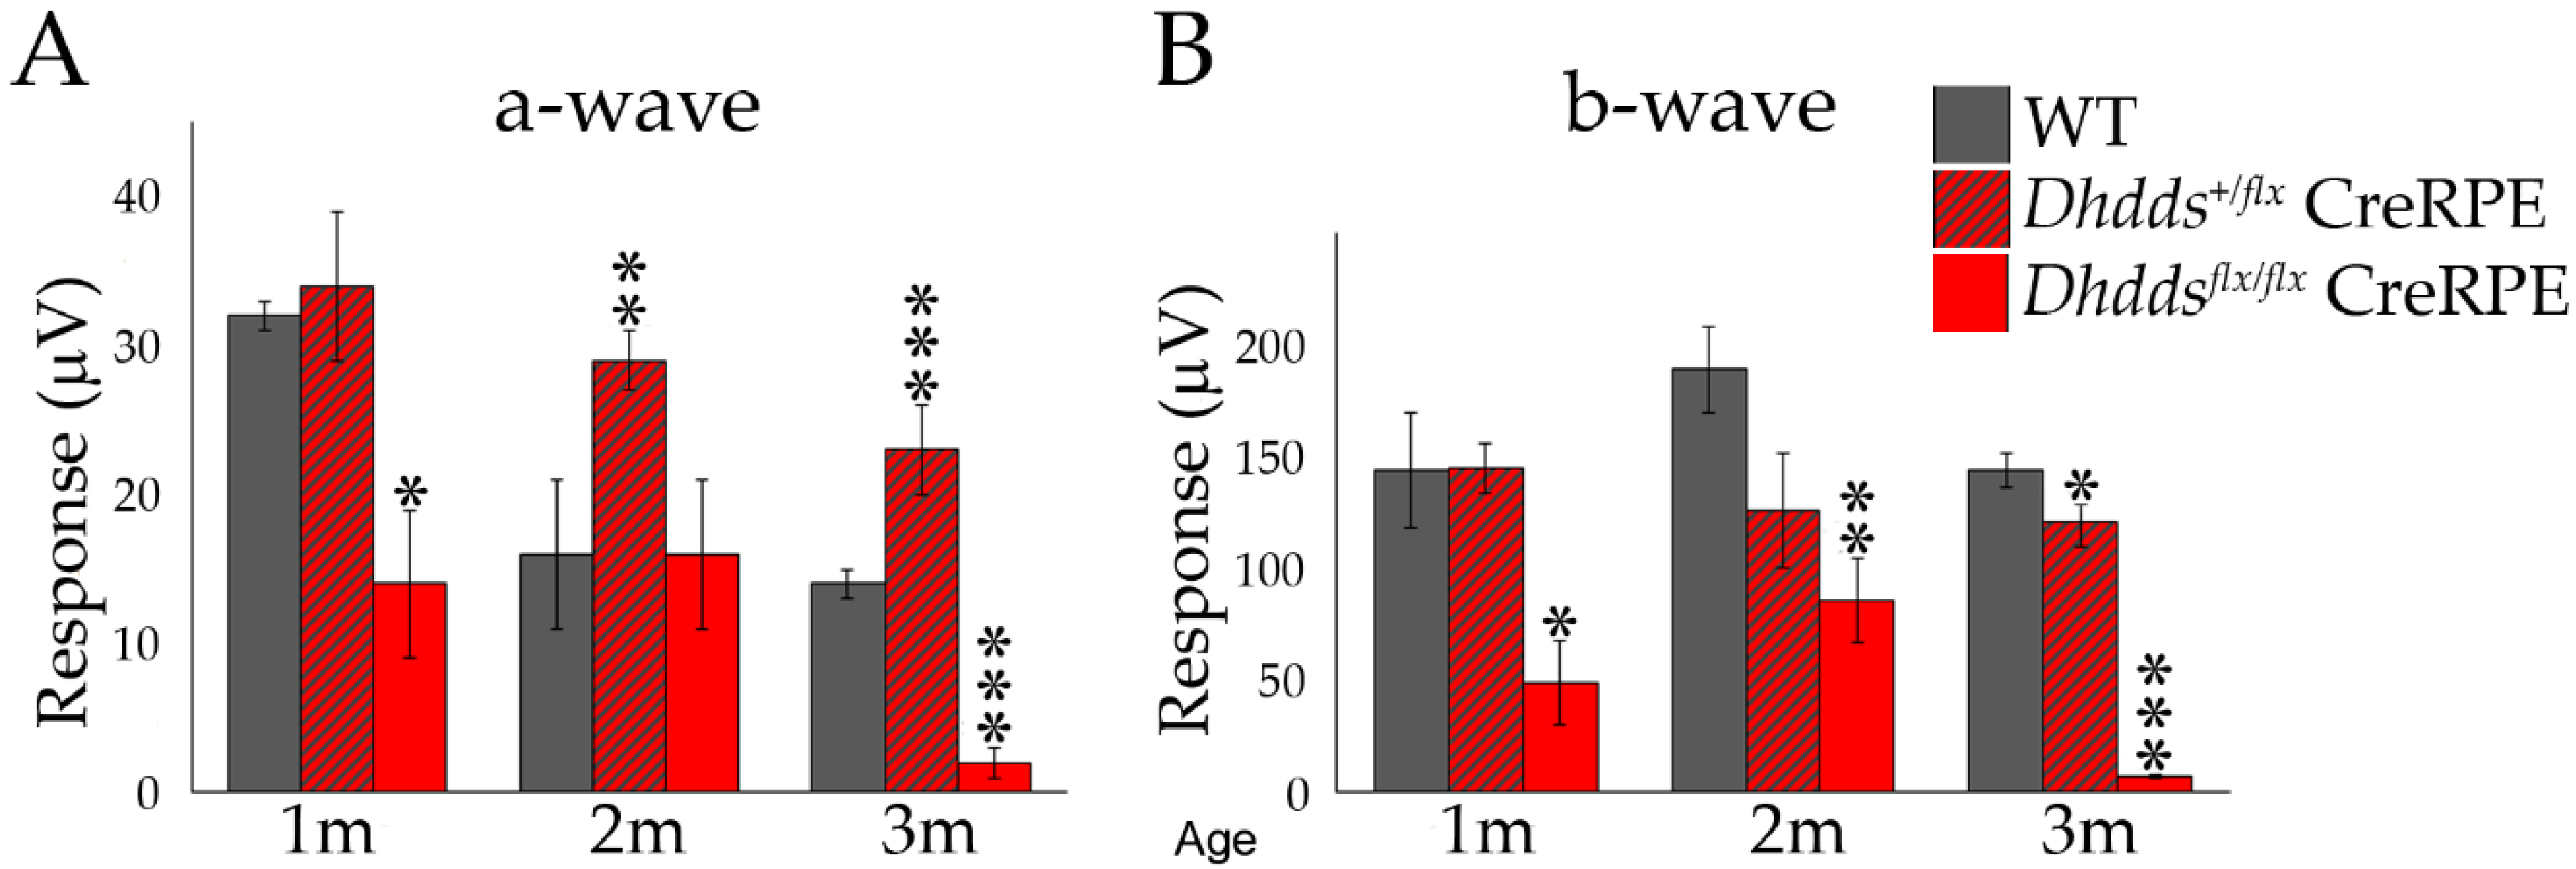
3.4. Altered Scotopic and Photopic ERG Amplitudes in Dhddsflx/flx CreRPE Mice
4. Discussion
5. Conclusions
Supplementary Materials
Author Contributions
Funding
Acknowledgments
Conflicts of Interest
References
- Dryja, T.P.; McGee, T.L.; Reichel, E.; Hahn, L.B.; Cowley, G.S.; Yandell, D.W.; Sandberg, M.A.; Berson, E.L. A point mutation of the rhodopsin gene in one form of retinitis pigmentosa. Nature 1990, 343, 364–366. [Google Scholar] [CrossRef] [PubMed]
- Bok, D.; Hall, M.O. The role of the pigment epithelium in the etiology of inherited retinal dystrophy in the rat. J. Cell Biol. 1971, 49, 664–682. [Google Scholar] [CrossRef] [PubMed]
- Clark, V.M.; Hall, M.O. RPE cell surface proteins in normal and dystrophic rats. Investig. Ophthalmol. Vis. Sci. 1986, 27, 136–144. [Google Scholar]
- Clark, V.M.; Zhou, X.Y.; Pfeffer, B.A. Partial characterization of fucosylated cell surface glycoproteins of cultured RPE. Curr. Eye Res. 1990, 9, 977–986. [Google Scholar] [CrossRef] [PubMed]
- Edwards, R.B.; Szamier, R.B. Defective phagocytosis of isolated rod outer segments by RCS rat retinal pigment epithelium in culture. Science 1977, 197, 1001–1003. [Google Scholar] [CrossRef]
- Buczkowska, A.; Swiezewska, E.; Lefeber, D.J. Genetic defects in dolichol metabolism. J. Inherit. Metab. Dis. 2015, 38, 157–169. [Google Scholar] [CrossRef] [Green Version]
- Giladi, M.; Edri, I.; Goldenberg, M.; Newman, H.; Strulovich, R.; Khananshvili, D.; Haitin, Y.; Loewenstein, A. Purification and characterization of human dehydrodolychil diphosphate synthase (DHDDS) overexpressed in E. coli. Protein Expr. Purif. 2017, 132, 138–142. [Google Scholar] [CrossRef]
- Kean, E.L. The dolichol pathway in the retina and its involvement in the glycosylation of rhodopsin. Biochim. Biophys. Acta 1999, 1473, 272–285. [Google Scholar] [CrossRef]
- Nowycky, M.C.; Wu, G.; Ledeen, R.W. Glycobiology of ion transport in the nervous system. Adv. Neurobiol. 2014, 9, 321–342. [Google Scholar] [CrossRef]
- Wimmers, S.; Karl, M.O.; Strauss, O. Ion channels in the RPE. Prog. Retin. Eye Res. 2007, 26, 263–301. [Google Scholar] [CrossRef]
- Lam, B.L.; Zuchner, S.L.; Dallman, J.; Wen, R.; Alfonso, E.C.; Vance, J.M.; Pericak-Vance, M.A. Mutation K42E in dehydrodolichol diphosphate synthase (DHDDS) causes recessive retinitis pigmentosa. Adv. Exp. Med. Biol. 2014, 801, 165–170. [Google Scholar] [CrossRef] [PubMed]
- Zelinger, L.; Banin, E.; Obolensky, A.; Mizrahi-Meissonnier, L.; Beryozkin, A.; Bandah-Rozenfeld, D.; Frenkel, S.; Ben-Yosef, T.; Merin, S.; Schwartz, S.B.; et al. A missense mutation in DHDDS, encoding dehydrodolichyl diphosphate synthase, is associated with autosomal-recessive retinitis pigmentosa in Ashkenazi Jews. Am. J. Hum. Genet. 2011, 88, 207–215. [Google Scholar] [CrossRef] [PubMed] [Green Version]
- Venturini, G.; Koskiniemi-Kuendig, H.; Harper, S.; Berson, E.L.; Rivolta, C. Two specific mutations are prevalent causes of recessive retinitis pigmentosa in North American patients of Jewish ancestry. Genet. Med. 2015, 17, 285–290. [Google Scholar] [CrossRef] [PubMed] [Green Version]
- Ng, B.G.; Freeze, H.H. Perspectives on Glycosylation and Its Congenital Disorders. Trends Genet. 2018, 34, 466–476. [Google Scholar] [CrossRef]
- Biswas, P.; Duncan, J.L.; Maranhao, B.; Kozak, I.; Branham, K.; Gabriel, L.; Lin, J.H.; Barteselli, G.; Navani, M.; Suk, J.J.; et al. Genetic analysis of ten pedigrees with inherited retinal degeneration (IRD) by exome sequencing and phenotype-genotype association. Physiol. Genom. 2017, 49, 216–229. [Google Scholar] [CrossRef]
- Kimchi, A.; Khateb, S.; Wen, R.; Guan, Z.; Obolensky, A.; Beryozkin, A.; Kurtzman, S.; Blumenfeld, A.; Pras, E.; Jacobson, S.G.; et al. Nonsyndromic Retinitis Pigmentosa in the Ashkenazi Jewish Population: Genetic and Clinical Aspects. Ophthalmology 2018, 125, 725–734. [Google Scholar] [CrossRef]
- Sabry, S.; Vuillaumier-Barrot, S.; Mintet, E.; Fasseu, M.; Valayannopoulos, V.; Heron, D.; Dorison, N.; Mignot, C.; Seta, N.; Chantret, I.; et al. A case of fatal Type I congenital disorders of glycosylation (CDG I) associated with low dehydrodolichol diphosphate synthase (DHDDS) activity. Orphanet J. Rare Dis. 2016, 11, 84. [Google Scholar] [CrossRef] [Green Version]
- Ferrara, N.; Carver-Moore, K.; Chen, H.; Dowd, M.; Lu, L.; O’Shea, K.S.; Powell-Braxton, L.; Hillan, K.J.; Moore, M.W. Heterozygous embryonic lethality induced by targeted inactivation of the VEGF gene. Nature 1996, 380, 439–442. [Google Scholar] [CrossRef] [Green Version]
- Rucker, E.B., 3rd; Dierisseau, P.; Wagner, K.U.; Garrett, L.; Wynshaw-Boris, A.; Flaws, J.A.; Hennighausen, L. Bcl-x and Bax regulate mouse primordial germ cell survival and apoptosis during embryogenesis. Mol. Endocrinol. 2000, 14, 1038–1052. [Google Scholar] [CrossRef]
- Le, Y.Z.; Zheng, W.; Rao, P.C.; Zheng, L.; Anderson, R.E.; Esumi, N.; Zack, D.J.; Zhu, M. Inducible expression of cre recombinase in the retinal pigmented epithelium. Investig. Ophthalmol. Vis. Sci. 2008, 49, 1248–1253. [Google Scholar] [CrossRef] [PubMed] [Green Version]
- Le, Y.Z.; Zhu, M.; Anderson, R.E. Cre Recombinase: You Can’t Live with It, and You Can’t Live Without It. Adv. Exp. Med. Biol. 2016, 854, 725–730. [Google Scholar] [CrossRef] [PubMed]
- DeRamus, M.L.; Stacks, D.A.; Zhang, Y.; Huisingh, C.E.; McGwin, G.; Pittler, S.J. GARP2 accelerates retinal degeneration in rod cGMP-gated cation channel beta-subunit knockout mice. Sci. Rep. 2017, 7, 42545. [Google Scholar] [CrossRef] [PubMed] [Green Version]
- Stricker, H.M.; Ding, X.Q.; Quiambao, A.; Fliesler, S.J.; Naash, M.I. The Cys214-->Ser mutation in peripherin/rds causes a loss-of-function phenotype in transgenic mice. Biochem. J. 2005, 388, 605–613. [Google Scholar] [CrossRef] [PubMed] [Green Version]
- Tu, C.; Li, J.; Jiang, X.; Sheflin, L.G.; Pfeffer, B.A.; Behringer, M.; Fliesler, S.J.; Qu, J. Ion-current-based proteomic profiling of the retina in a rat model of Smith-Lemli-Opitz syndrome. Mol. Cell. Proteom. 2013, 12, 3583–3598. [Google Scholar] [CrossRef] [PubMed] [Green Version]
- Zanzottera, E.C.; Ach, T.; Huisingh, C.; Messinger, J.D.; Spaide, R.F.; Curcio, C.A. Visualizing retinal pigment epithelium phenotypes in the transition to geographic atrophy in age-related macular degeneration. Retina 2016, 36, S12–S25. [Google Scholar] [CrossRef]
- Zuchner, S.; Dallman, J.; Wen, R.; Beecham, G.; Naj, A.; Farooq, A.; Kohli, M.A.; Whitehead, P.L.; Hulme, W.; Konidari, I.; et al. Whole-exome sequencing links a variant in DHDDS to retinitis pigmentosa. Am. J. Hum. Genet. 2011, 88, 201–206. [Google Scholar] [CrossRef] [Green Version]
- Grabińska, K.A.; Park, E.J.; Sessa, W.C. cis-Prenyltransferase: New insights into protein glycosylation, rubber synthesis, and human diseases. J. Biol. Chem. 2016, 291, 18582–18590. [Google Scholar] [CrossRef] [Green Version]
- Park, E.J.; Grabinska, K.A.; Guan, Z.; Stranecky, V.; Hartmannova, H.; Hodanova, K.; Baresova, V.; Sovova, J.; Jozsef, L.; Ondruskova, N.; et al. Mutation of Nogo-B receptor, a subunit of cis-prenyltransferase, causes a congenital disorder of glycosylation. Cell Metab. 2014, 20, 448–457. [Google Scholar] [CrossRef] [Green Version]
- Murray, A.R.; Fliesler, S.J.; Al-Ubaidi, M.R. Rhodopsin: The functional significance of asn-linked glycosylation and other post-translational modifications. Ophthalmic Genet. 2009, 30, 109–120. [Google Scholar] [CrossRef] [Green Version]
- White, D.A.; Fritz, J.J.; Hauswirth, W.W.; Kaushal, S.; Lewin, A.S. Increased sensitivity to light-induced damage in a mouse model of autosomal dominant retinal disease. Investig. Ophthalmol. Vis. Sci. 2007, 48, 1942–1951. [Google Scholar] [CrossRef]
- Ramachanra Rao, S.; Fliesler, S.J.; Nguyen, M.N.; Kotla, P.; Pittler, S.J. Lack of overt retinal degeneration in K42E DHDDS knock-in mouse model of RP59. Cells 2020. submitted. [Google Scholar]


© 2020 by the authors. Licensee MDPI, Basel, Switzerland. This article is an open access article distributed under the terms and conditions of the Creative Commons Attribution (CC BY) license (http://creativecommons.org/licenses/by/4.0/).
Share and Cite
DeRamus, M.L.; Davis, S.J.; Rao, S.R.; Nyankerh, C.; Stacks, D.; Kraft, T.W.; Fliesler, S.J.; Pittler, S.J. Selective Ablation of Dehydrodolichyl Diphosphate Synthase in Murine Retinal Pigment Epithelium (RPE) Causes RPE Atrophy and Retinal Degeneration. Cells 2020, 9, 771. https://doi.org/10.3390/cells9030771
DeRamus ML, Davis SJ, Rao SR, Nyankerh C, Stacks D, Kraft TW, Fliesler SJ, Pittler SJ. Selective Ablation of Dehydrodolichyl Diphosphate Synthase in Murine Retinal Pigment Epithelium (RPE) Causes RPE Atrophy and Retinal Degeneration. Cells. 2020; 9(3):771. https://doi.org/10.3390/cells9030771
Chicago/Turabian StyleDeRamus, Marci L., Stephanie J. Davis, Sriganesh Ramachandra Rao, Cyril Nyankerh, Delores Stacks, Timothy W. Kraft, Steven J. Fliesler, and Steven J. Pittler. 2020. "Selective Ablation of Dehydrodolichyl Diphosphate Synthase in Murine Retinal Pigment Epithelium (RPE) Causes RPE Atrophy and Retinal Degeneration" Cells 9, no. 3: 771. https://doi.org/10.3390/cells9030771