Global Drifter Program
Cornerstone of the Global Ocean Observing System
JUMP TO DATA OR SCROLL TO LEARN MORE
Who We Are
What We Do
The Global Drifter Program is a branch of NOAA’s Global Ocean Observing System and a scientific project of the Data Buoy Cooperation Panel. It has two components: the Global Drifter Center at AOML and the Lagrangian Drifter Laboratory (LDL) at Scripps Institution of Oceanography, UC San Diego. The LDL supervises drifter production, designs and tests new types of drifters, and manages the real-time data flow on the Global Telecommunications System.
Objectives of the Global Drifter Center
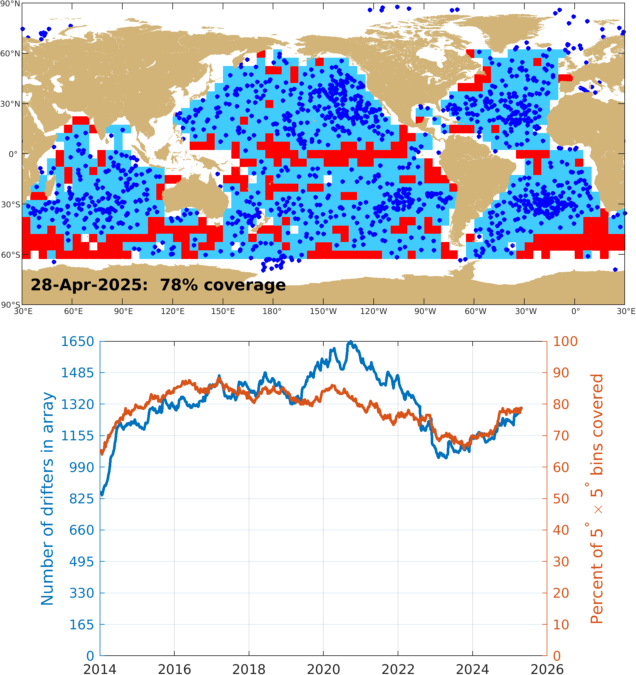
- Maintain a global 5° x 5° gridded array of ~1,300 satellite-tracked surface drifting buoys to meet the need for an accurate and globally dense set of in-situ observations of mixed layer currents, sea surface temperature, atmospheric pressure, winds, waves, and salinity.
- Provide a data processing system for the use of these data.


| Rick Lumpkin, Ph.D
Principal Investigator, Global Drifter Center


Top News
ERDDAP Server Increases Access to Drifting Buoy Data
September 18, 2023
The Global Drifter Program at AOML has a new ERDDAP, or Environmental Research Division Data Access Program, server that is now publicly available and hosts both hourly and 6-hour quality-controlled interpolated drifter datasets. This new scientific data server uses free and open-source software created by the Environmental Research Division of NOAA’s Southwest Fisheries Science Center.


Read More News
Drifters Provide Critical Data to Improve Forecasts
The impact of Global Drifter data is the most valuable per-observation contributor to the Global Ocean Observing System for improving weather forecasts. This data helps improve forecasts by providing observational validation of global surface pressure. This data is also critical to marine forecasts, especially in places like the Southern Ocean, where no other in situ observations are available.
Source: American Meteorological Society
Drifter surface pressure observations contribute to decrease the total global forecast error by approximately 3%. In particular, case‐studies reveal that drifting buoy observations can be especially important to reduce the forecast error on complex or rapidly evolving cyclogenesis.
Source: Royal Meteorological Society
Background
Recognizing the Need for a Global Ocean Observing System
As weather forecasters developed numerical models to predict weather in the 1950s and 1960s, they realized that the greatest limitation to improving forecast accuracy was not computer power, but the scarcity of observations. Land stations measure air pressure over land and transmit the observations to the forecasters, but over 70% of the earth’s surface is covered by oceans. To address this, NOAA’s Global Drifter Program (GDP) maintains an array of over 1,000 drifting buoys that measure air pressure over the ocean and send these data to satellites passing overhead, which then transmit the data within an hour to the forecasters. Drifters are deployed by national and international partners of the GDP, coordinated by the GDP’s Drifter Operations Center at AOML. The data are then processed and quality controlled at the GDP’s Data Assembly Center, also located at AOML.
The Global Drifter Program
The program manages the collection, analysis, and distribution of the data acquired by these drifters. The program reached its goal of 1250 operational drifters on September 18th, 2005 and has maintained these drifters since. It was the first component of the Global Ocean Observing System to reach completion.
Components of a Drifter

All drifters measure sea surface temperature, but most are also equipped to measure other variables. As the drifter moves around, guided by ocean currents, measurements of atmospheric pressure, winds, wave height, and salinity can be taken. This data is collected by sensors in the drifter and transmitted to overhead satellites. Tracking the location of drifters over time allows scientists to build a profile of ocean currents.
A drifter’s drogue, also known as a sea anchor, extends 20 meters (or 65 feet) deep and is designed to move with the near-surface ocean currents. The drogue and surface float move together, connected by a long tether. Without a drogue, the drifter will be transported by wind and waves, much as a ping pong ball or beach ball is pushed across the surface of a pool.
New ERDDAP Server
The Global Drifter Program at AOML has a new ERDDAP, or Environmental Research Division Data Access Program, server that is now publicly available and hosts both hourly and 6-hour quality-controlled interpolated drifter datasets. This new scientific data server uses free and open-source software created by the Environmental Research Division of NOAA’s Southwest Fisheries Science Center.
With the growing importance for strong data management principles, Samantha Ouertani’s ‘An Overview of the Global Drifter Program’s ERDDAP Server: From Set-up to Metrics’ seminar detailing the benefits of the Global Drifter Program’s ERDDAP server is available on Youtube. For those interested in establishing an ERDDAP server, reference the presentation for great insight, links, and additional resources!
New Interactive Map & Data Visualization
The Global Drifter Program’s (GDP) Drifter Data Assembly Center (DAC) at AOML has launched a new interactive map of the global drifter array. This new tool features the ability to zoom and scroll, hover the cursor over drifters to get their identification numbers, and click to see data and metadata including deployment information, manufacturer, and drifter type in an ID card that can be viewed as a high-resolution image with an additional click. Visit the new tool.

More Drifter Maps
About 1000 drifters are deployed each year by the Global Drifter Program and its international partners to maintain the global 5° x 5° gridded array of ~1300 drifters. To view the number of deployments per year and their locations, please visit the reports archive.


Drifter Deployment
Instructions & Value Maps
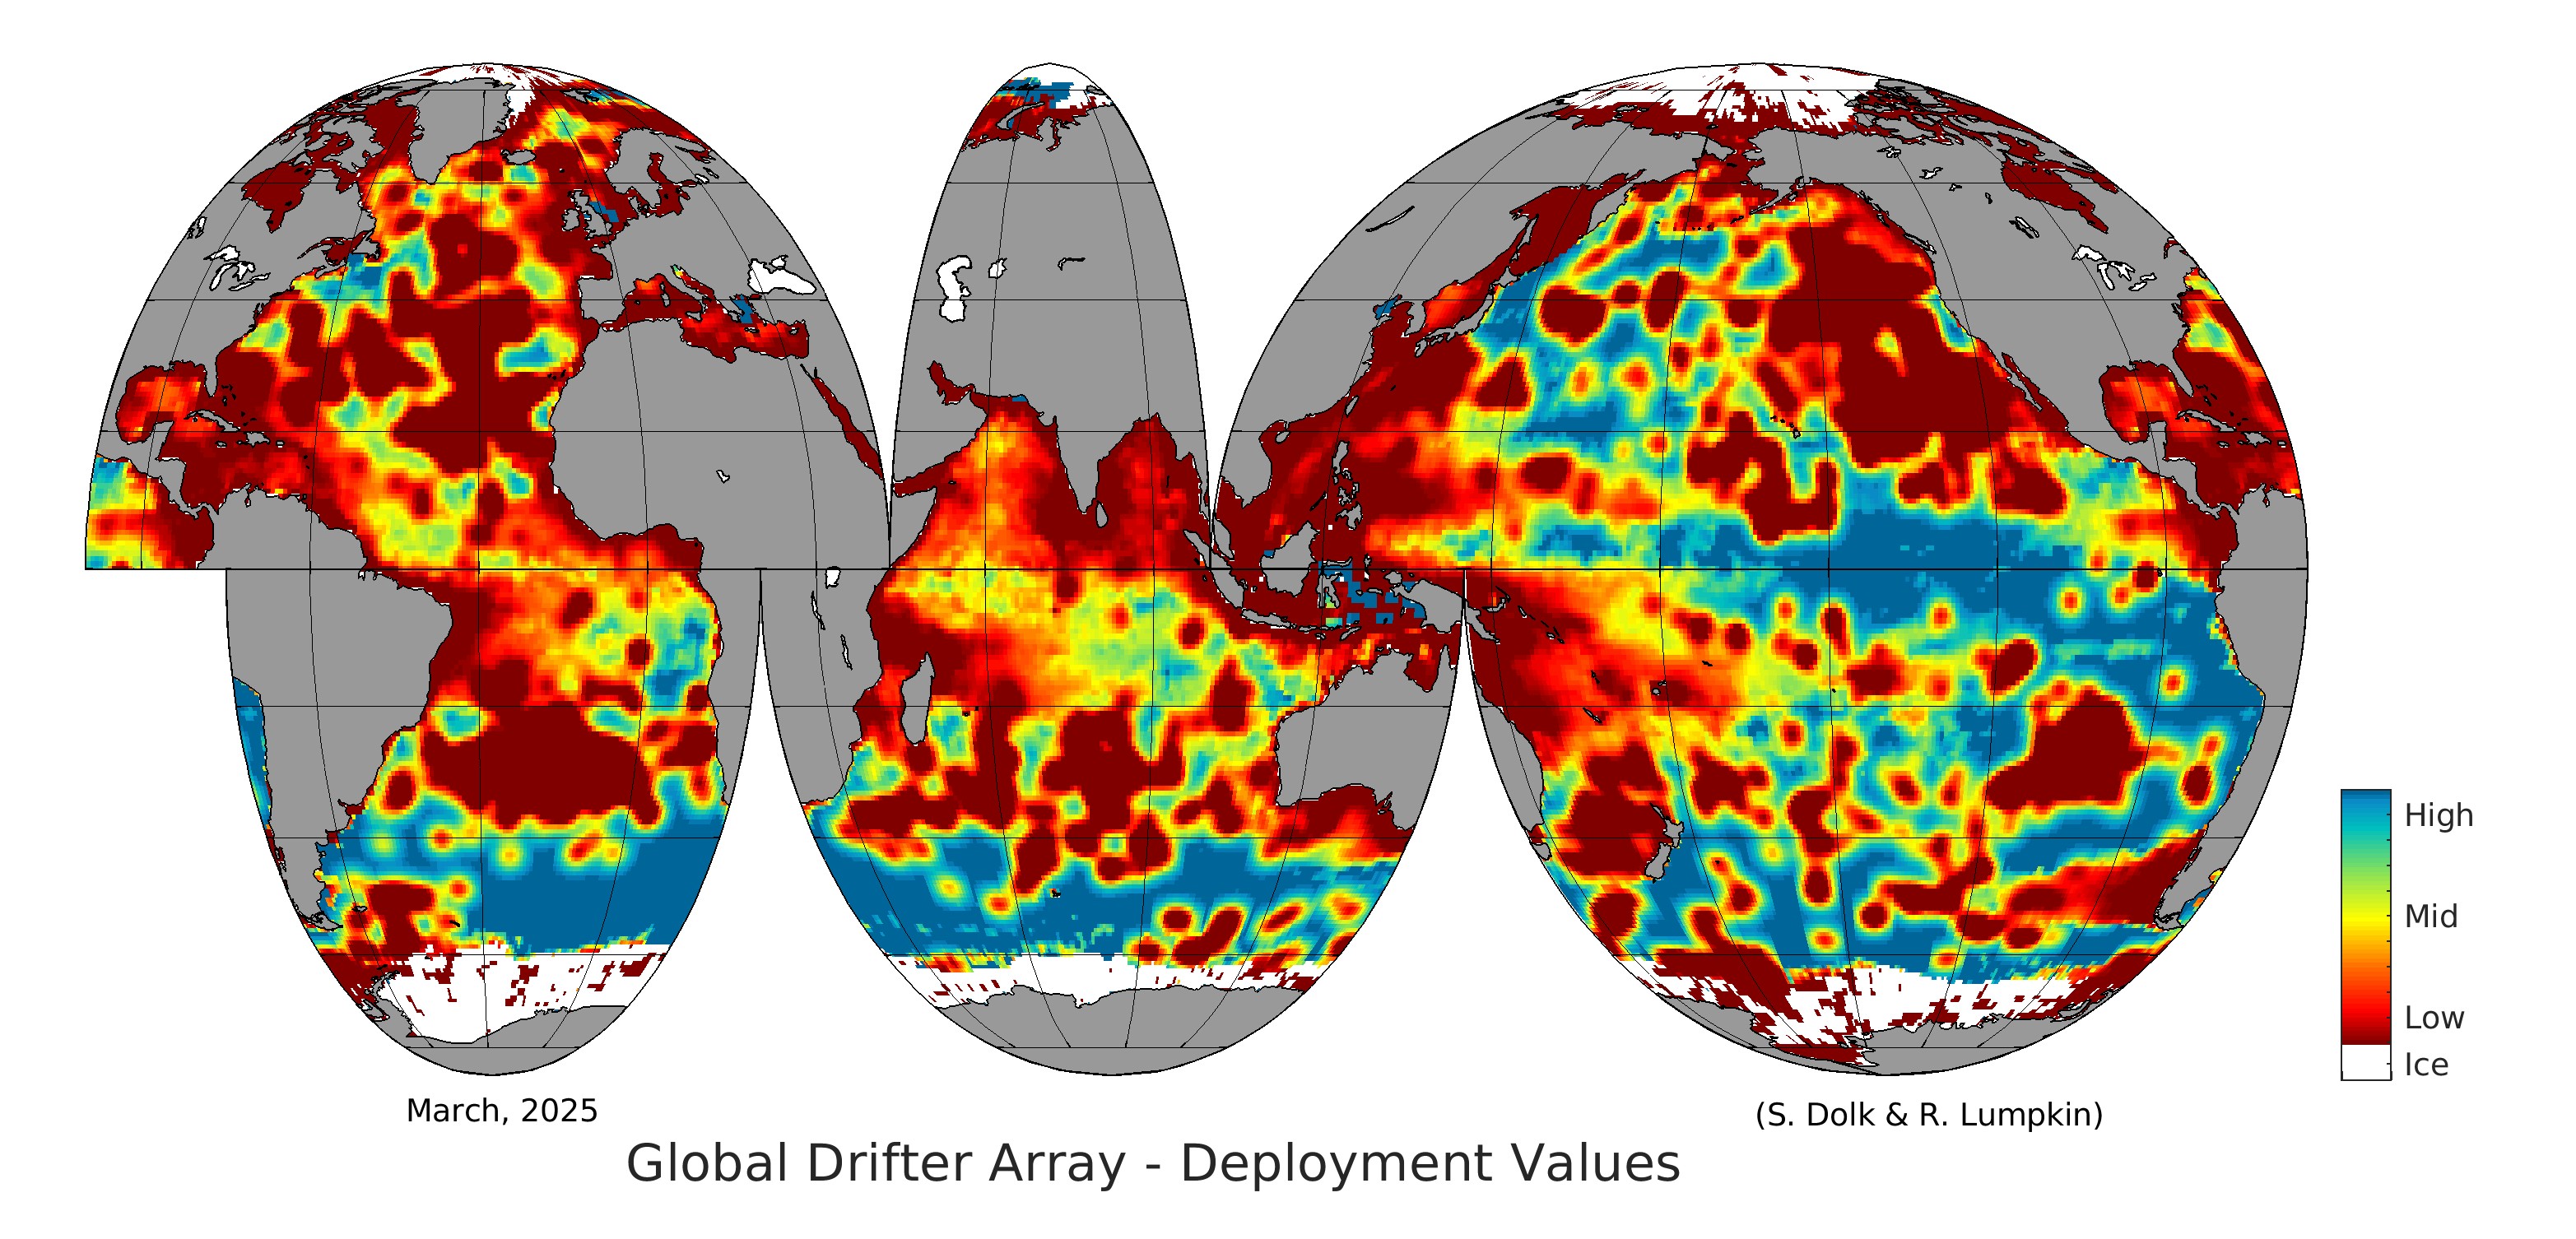
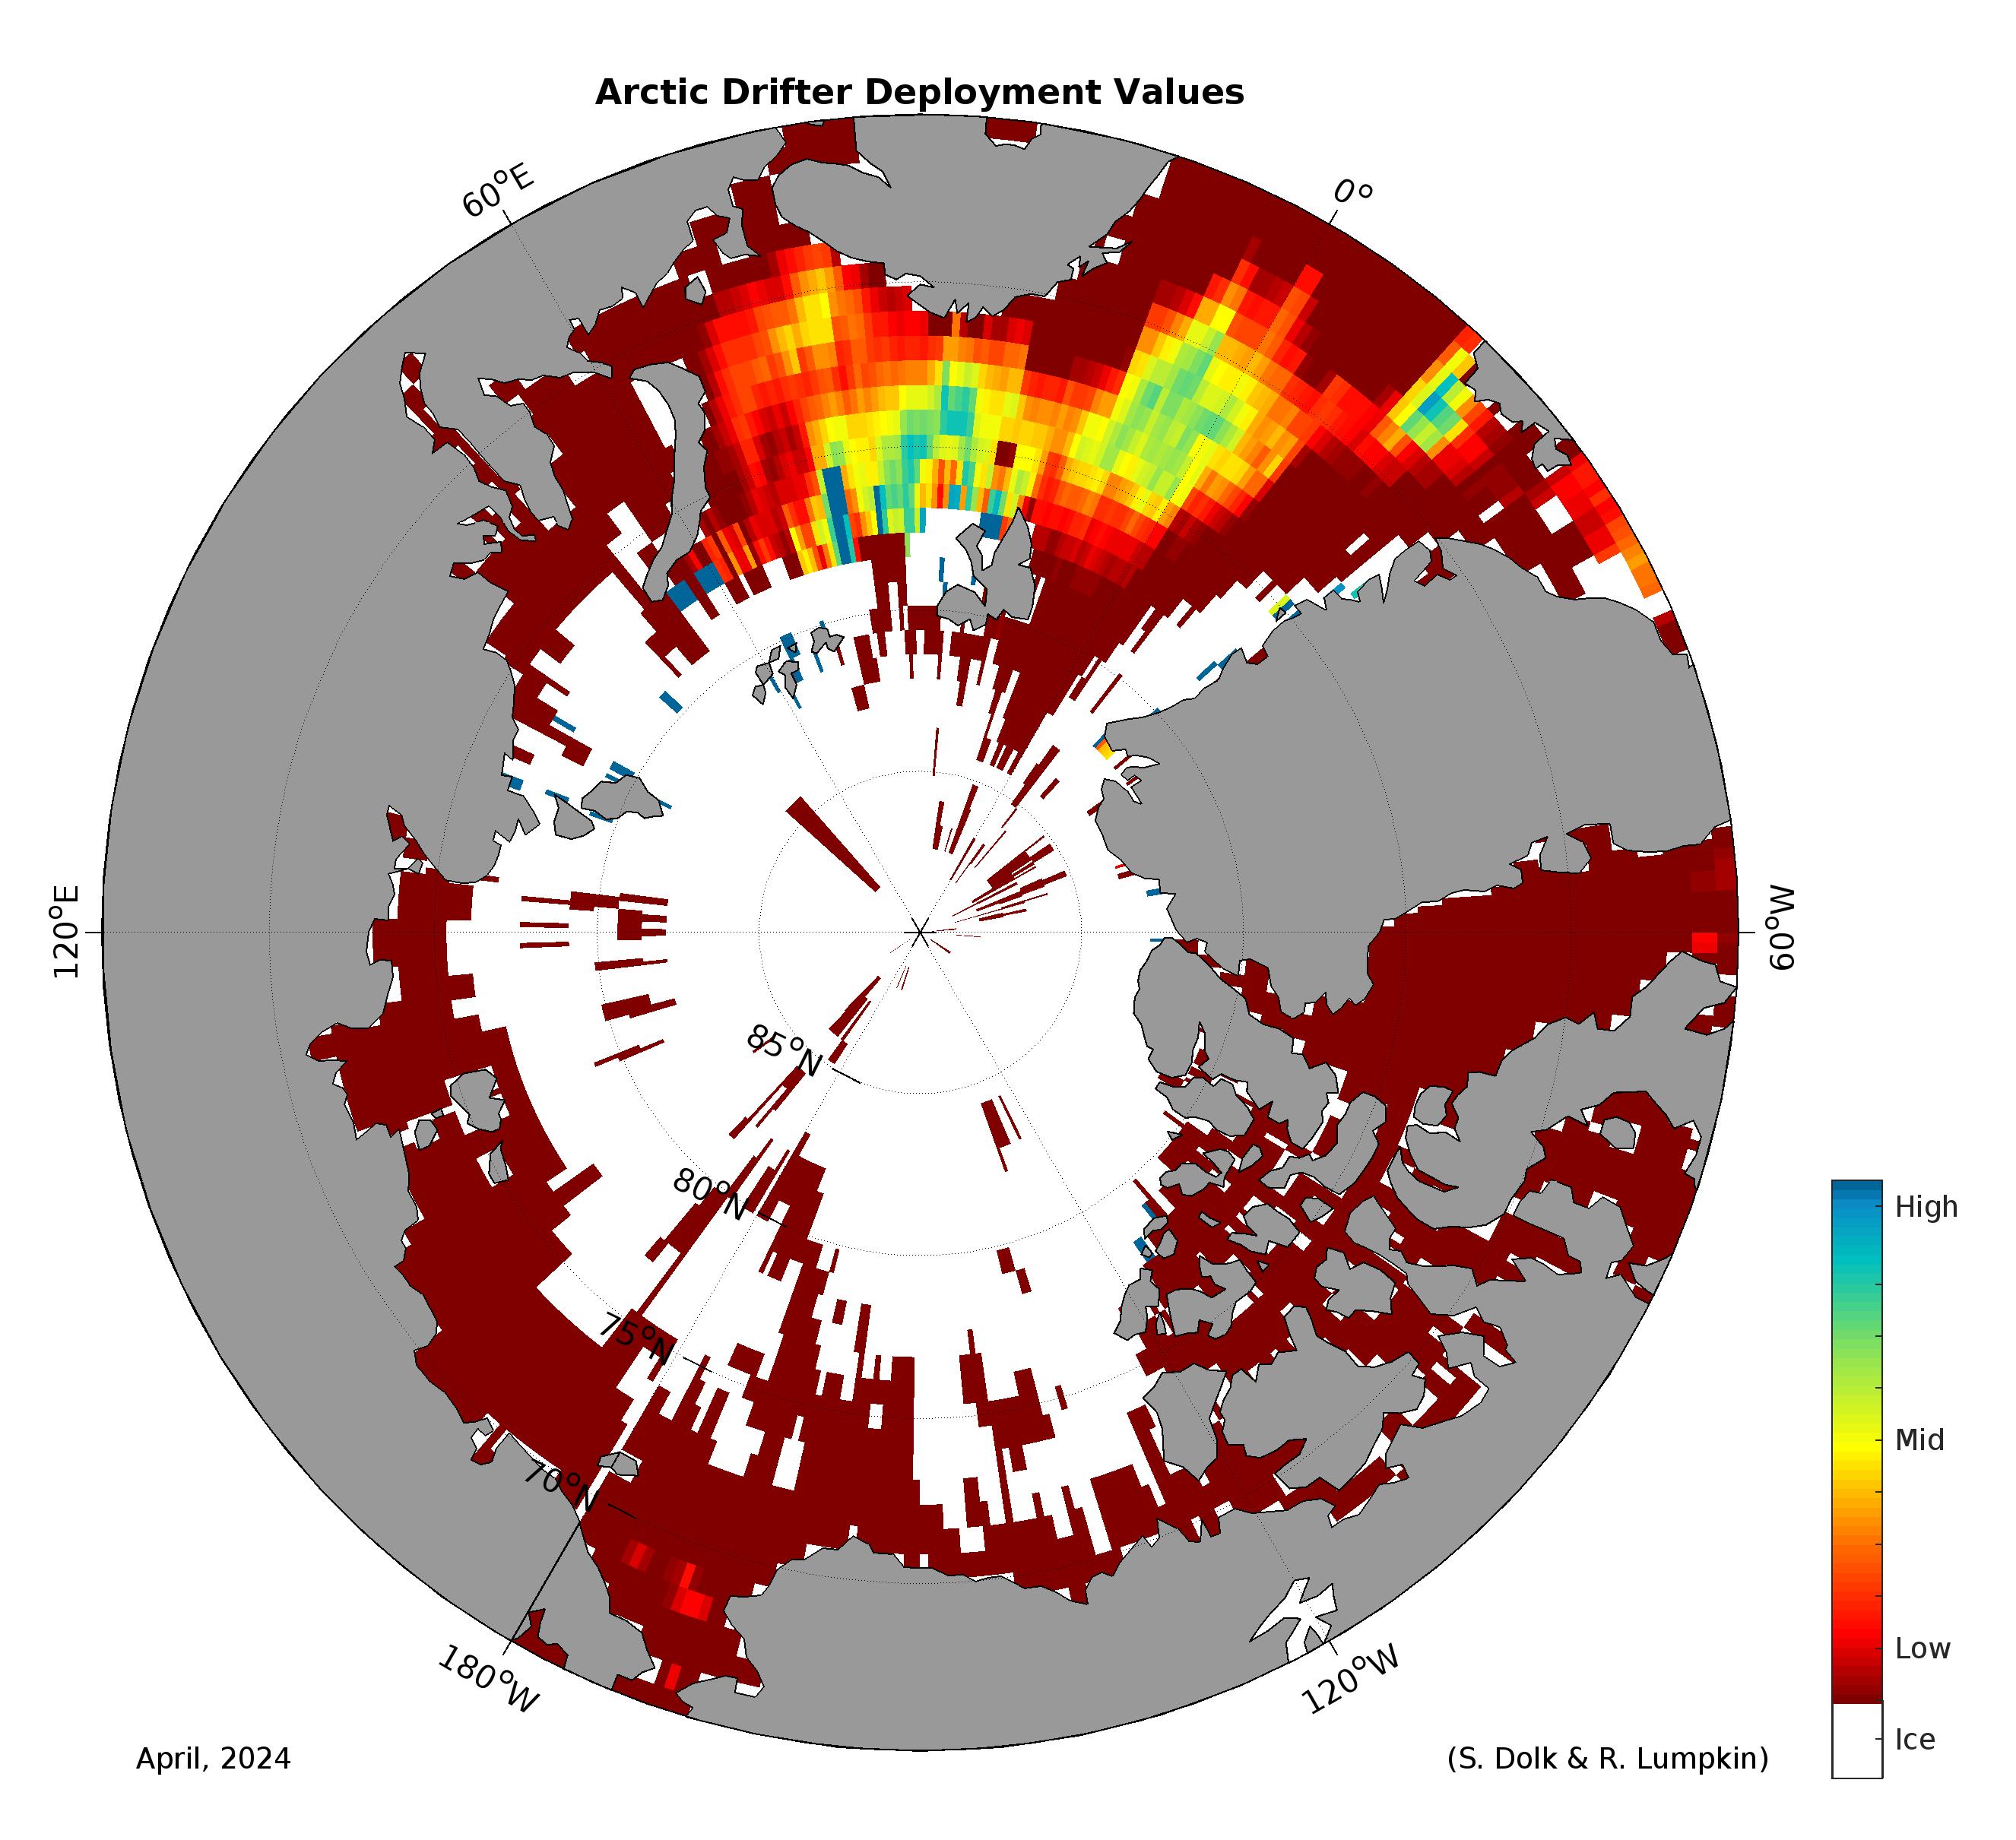
The goal of the drifter program is to implement one drifter in each 5° x 5° grid section of the oceans across the globe. Of course, with strong convergent and divergent currents to contend with, as well as limited access to deployment vessels, the Global Drifter Program works closely with more than fifty domestic and international agencies to coordinate deployment efforts.
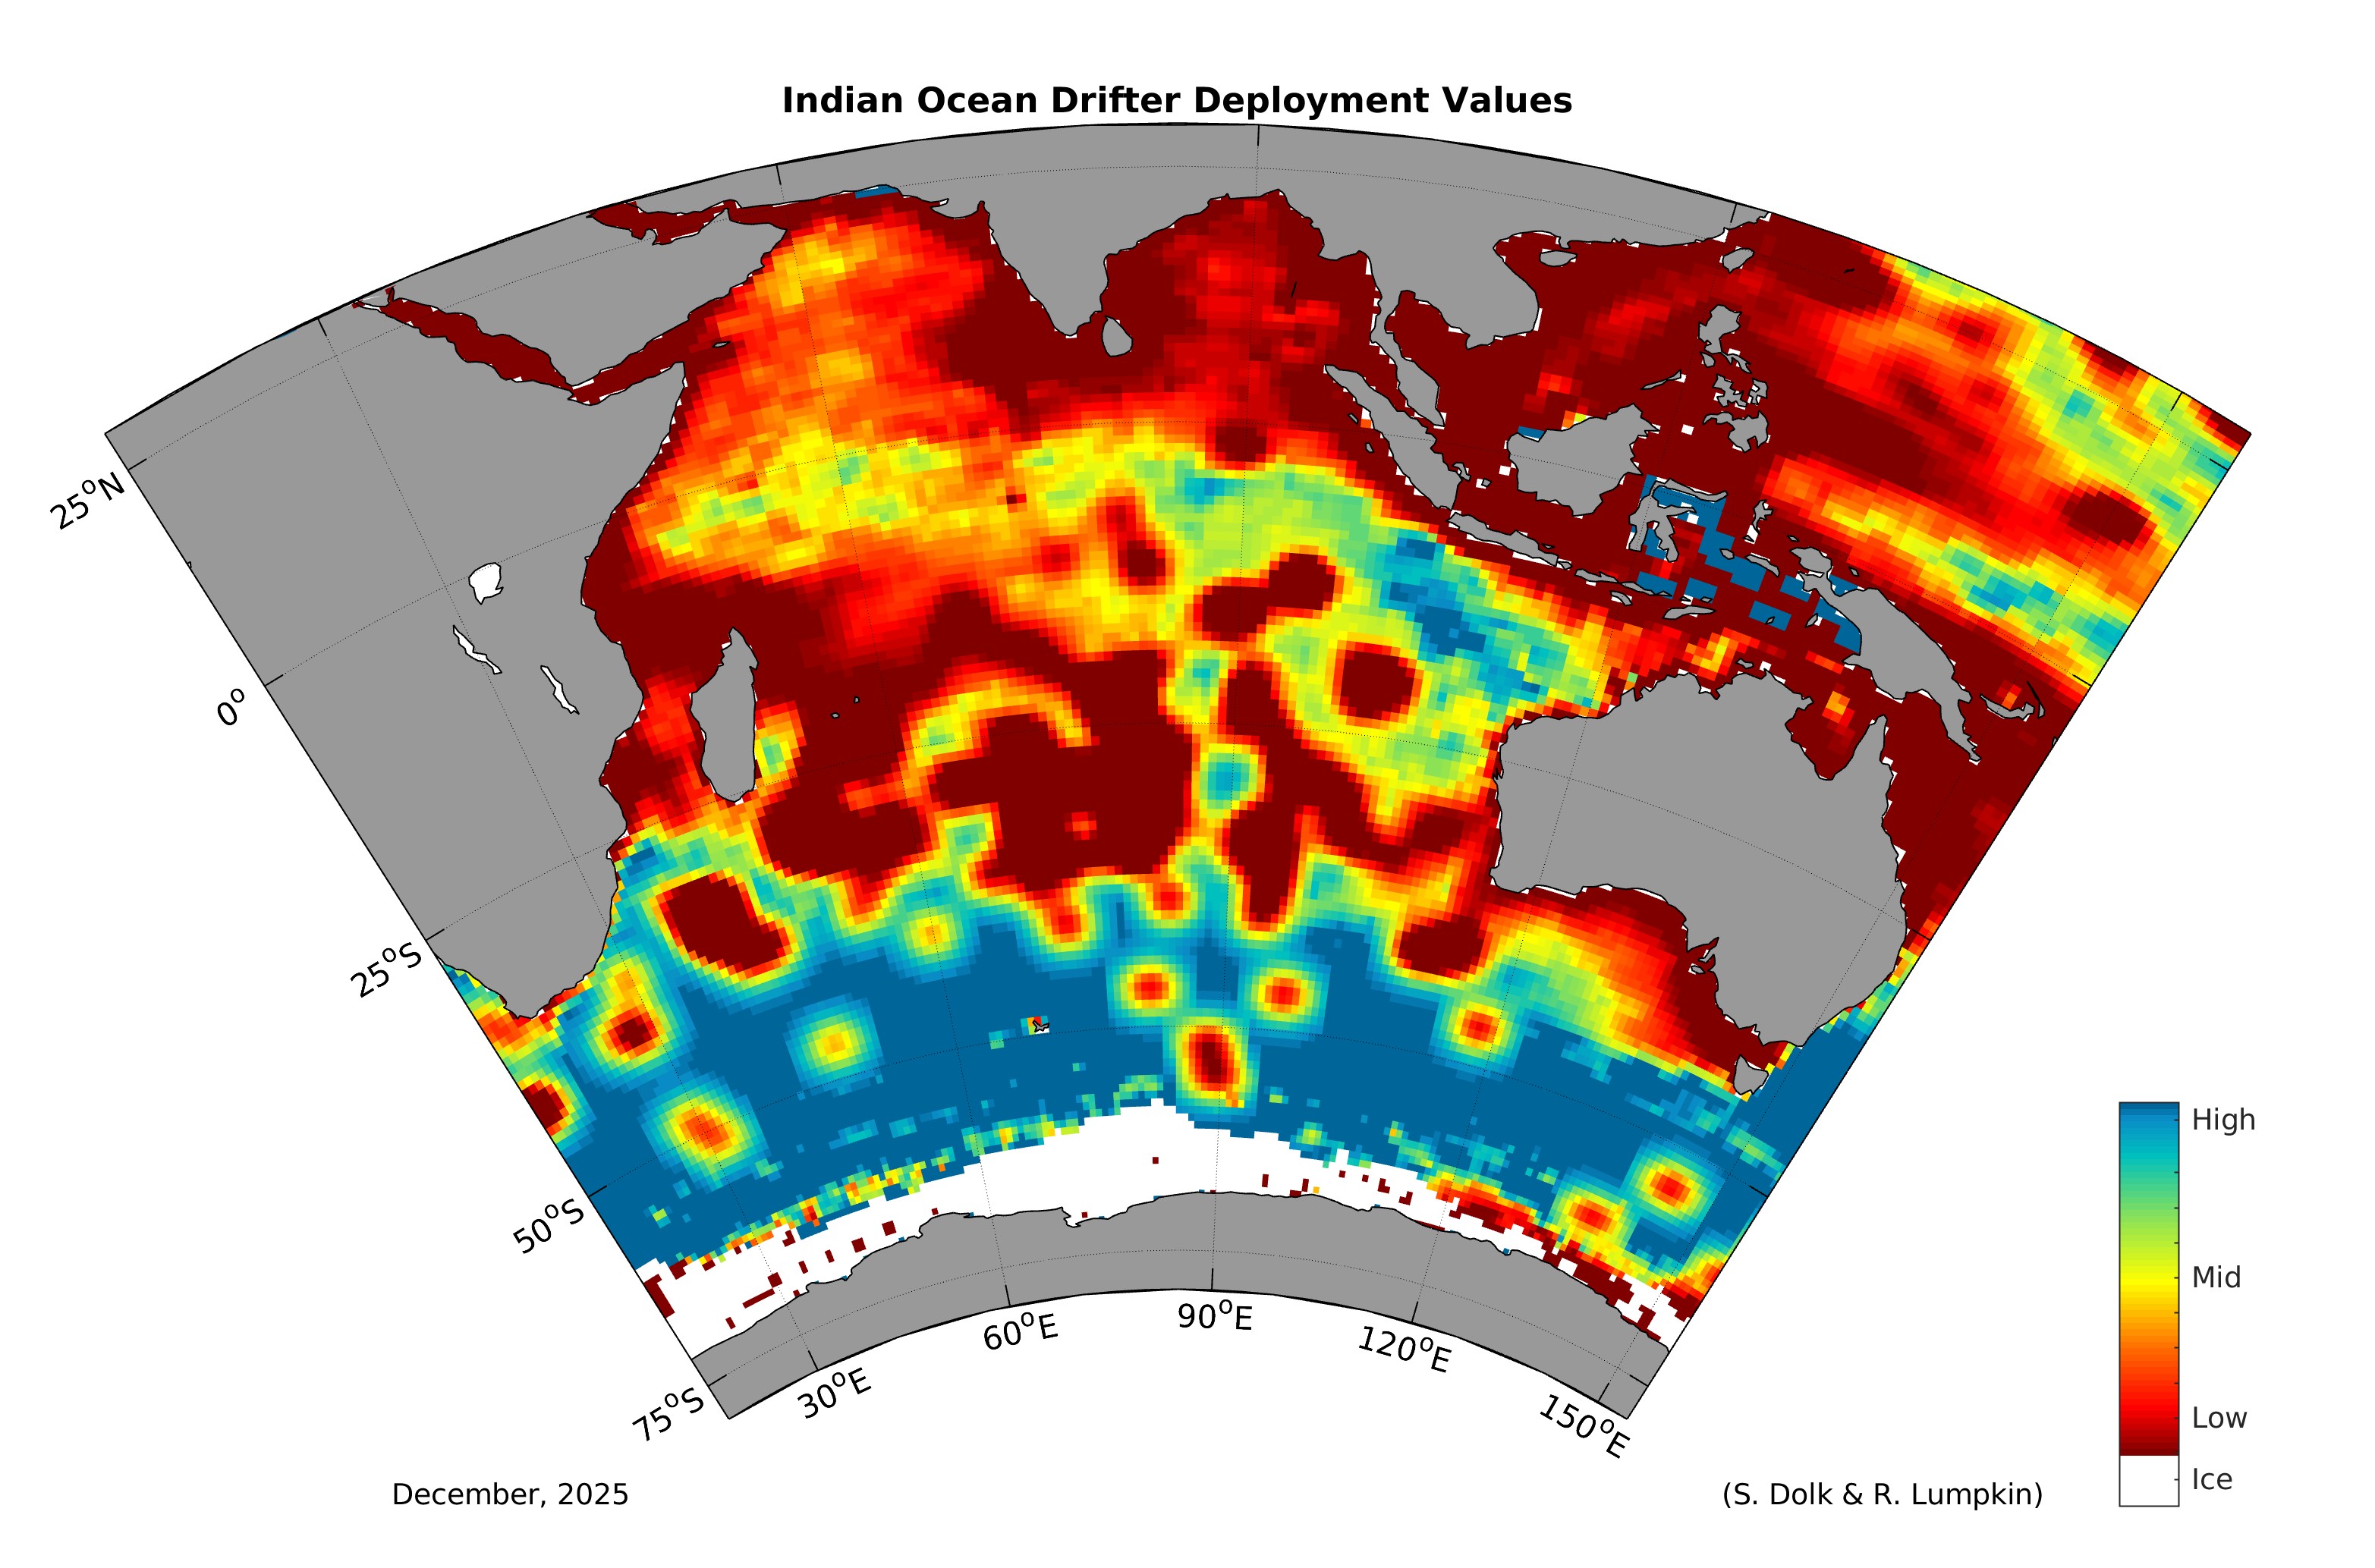
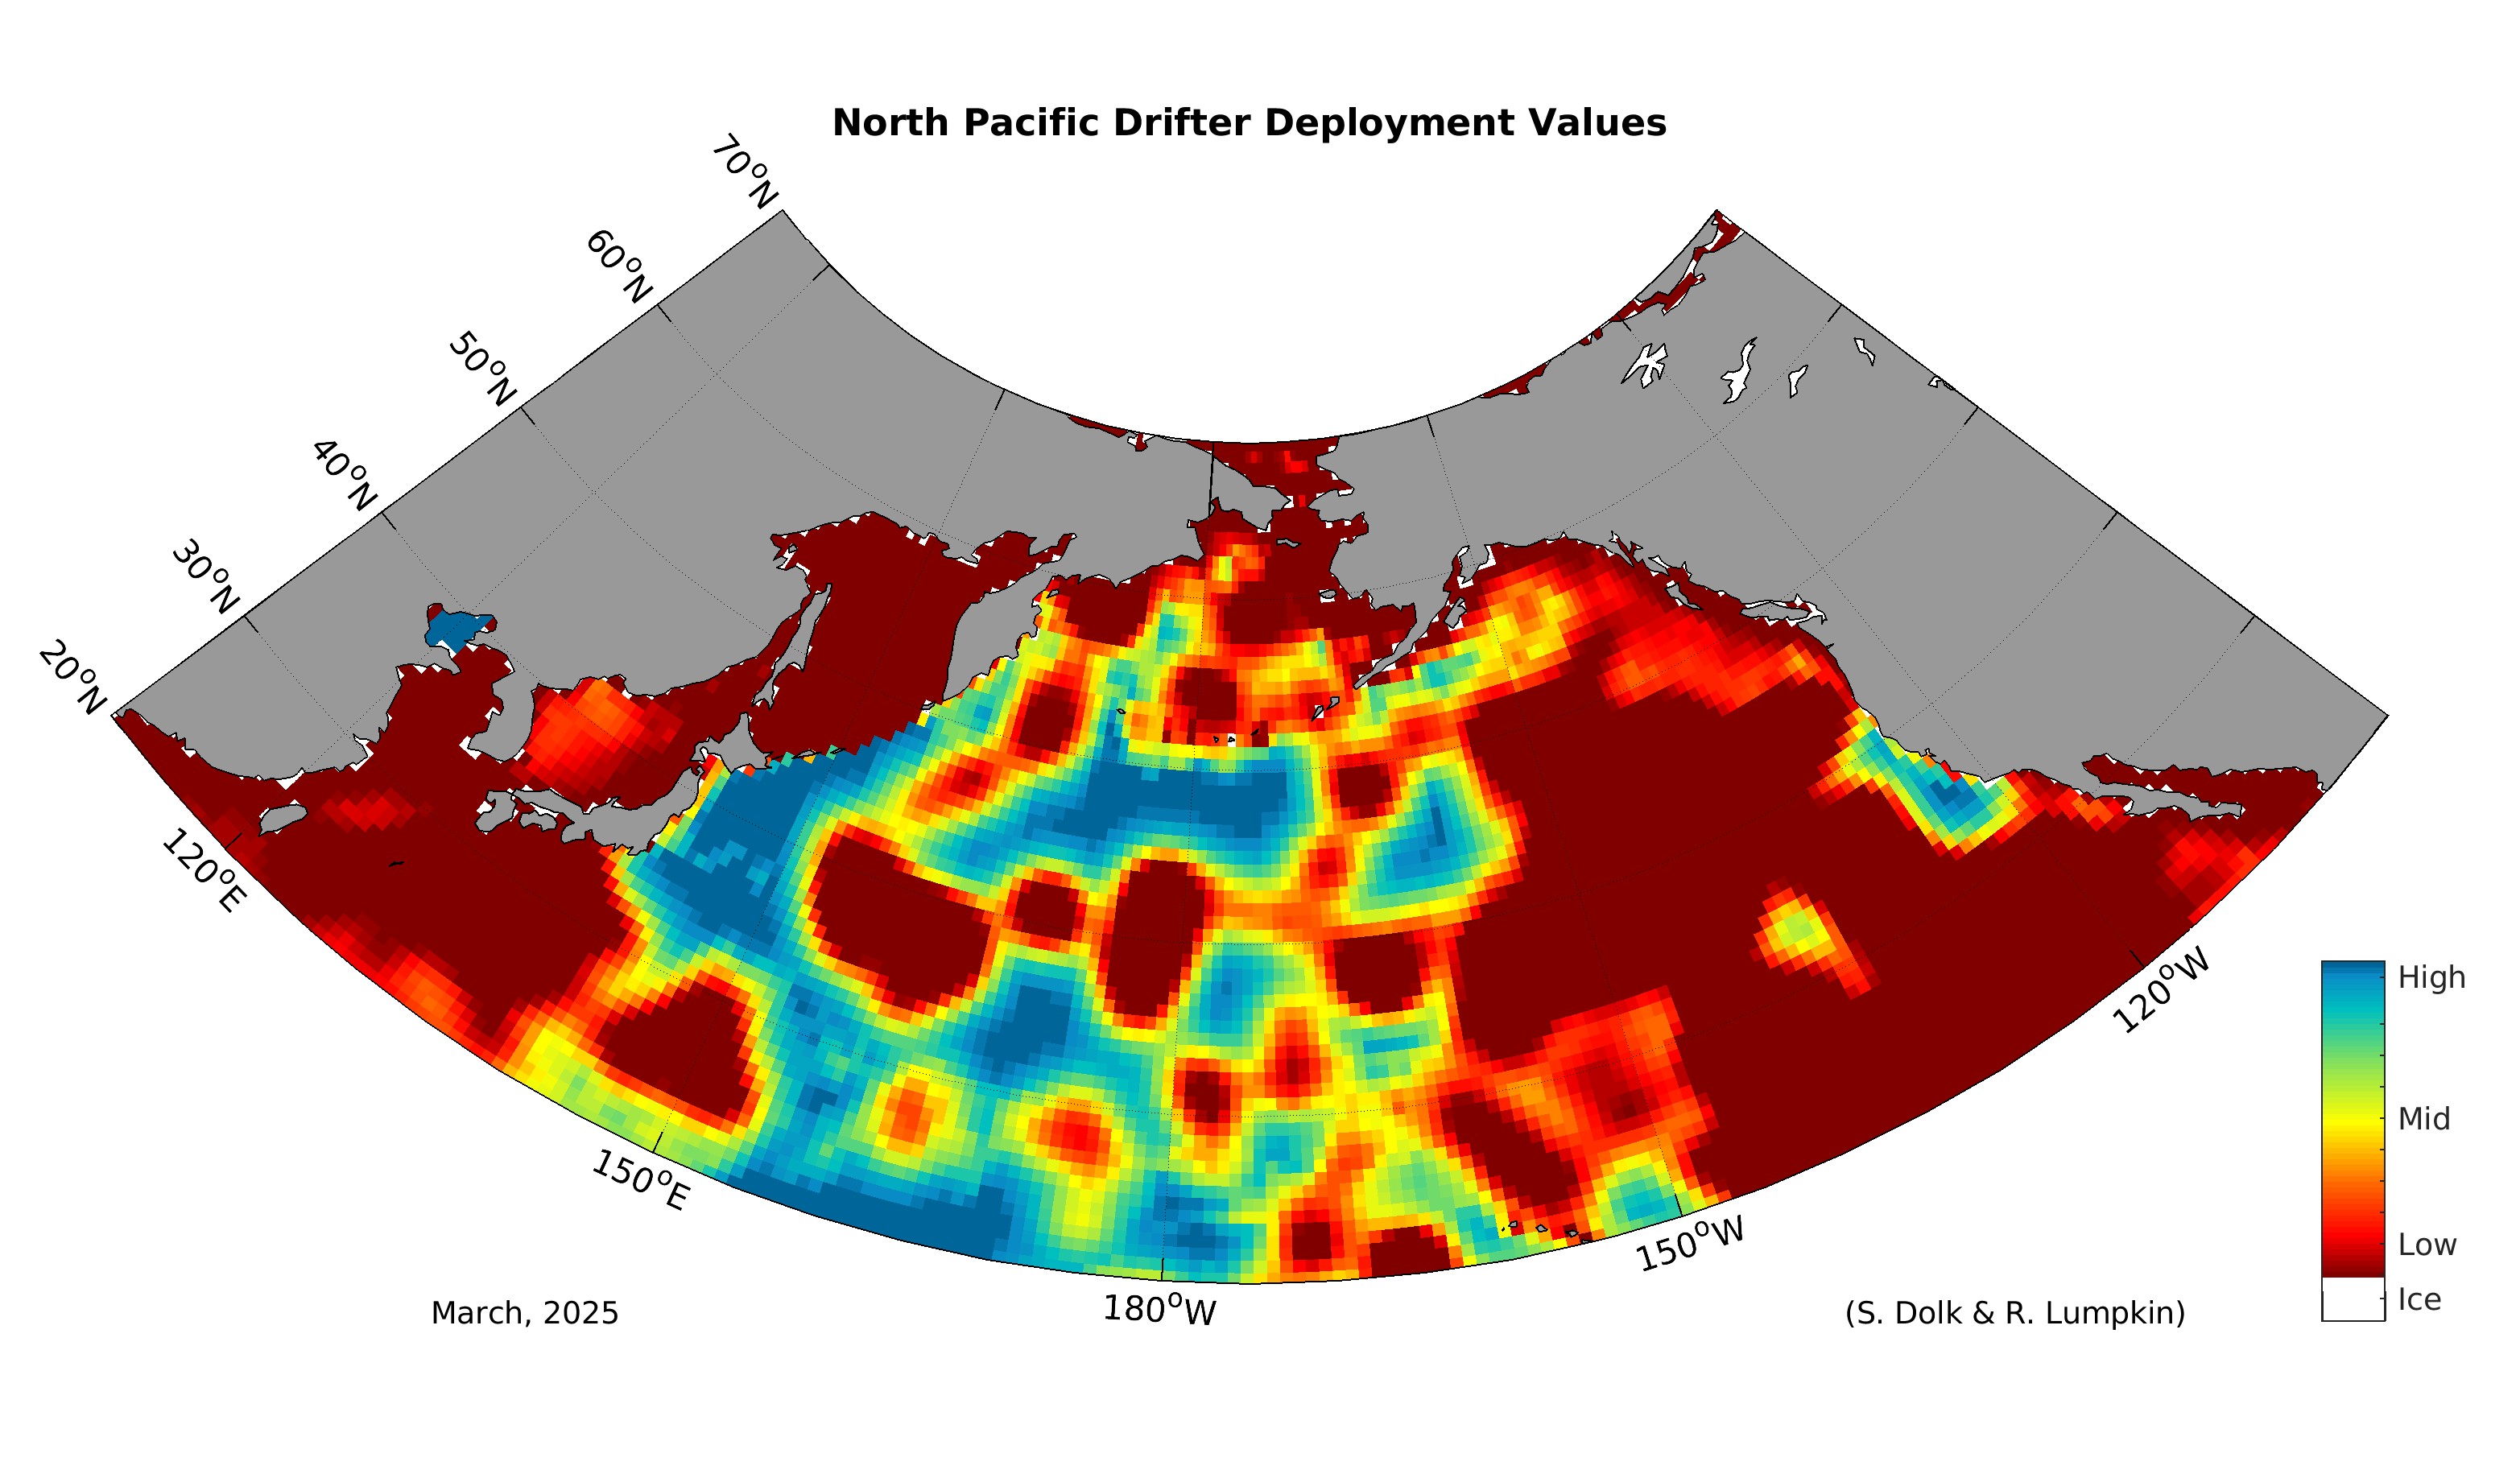
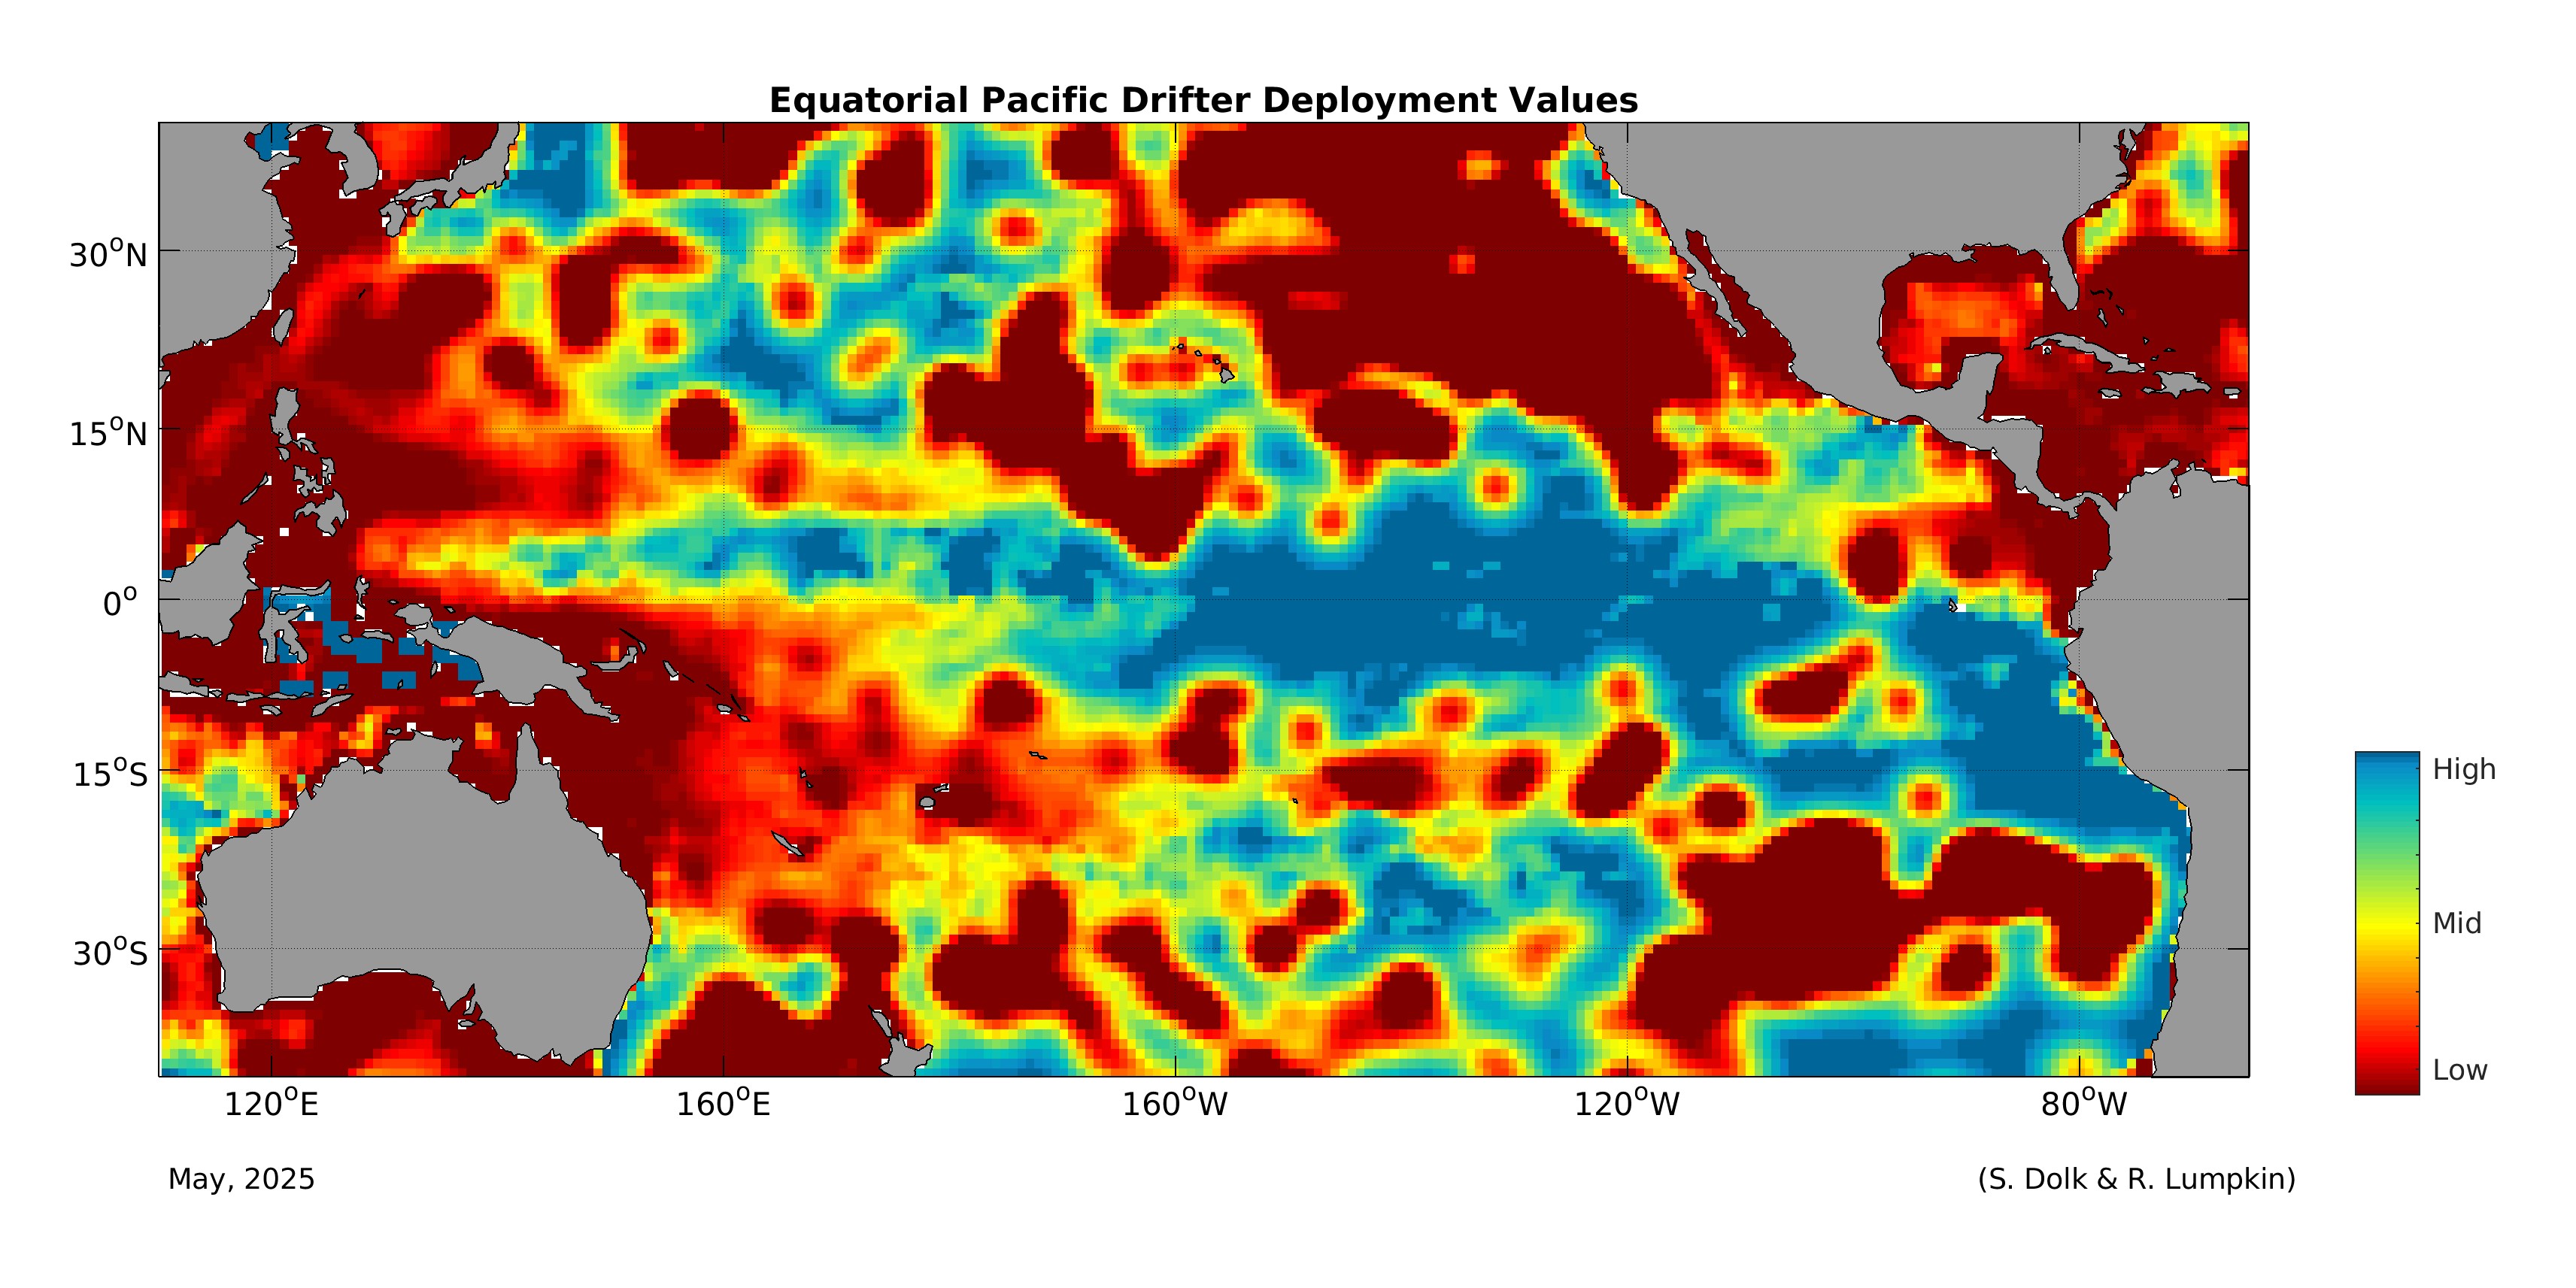
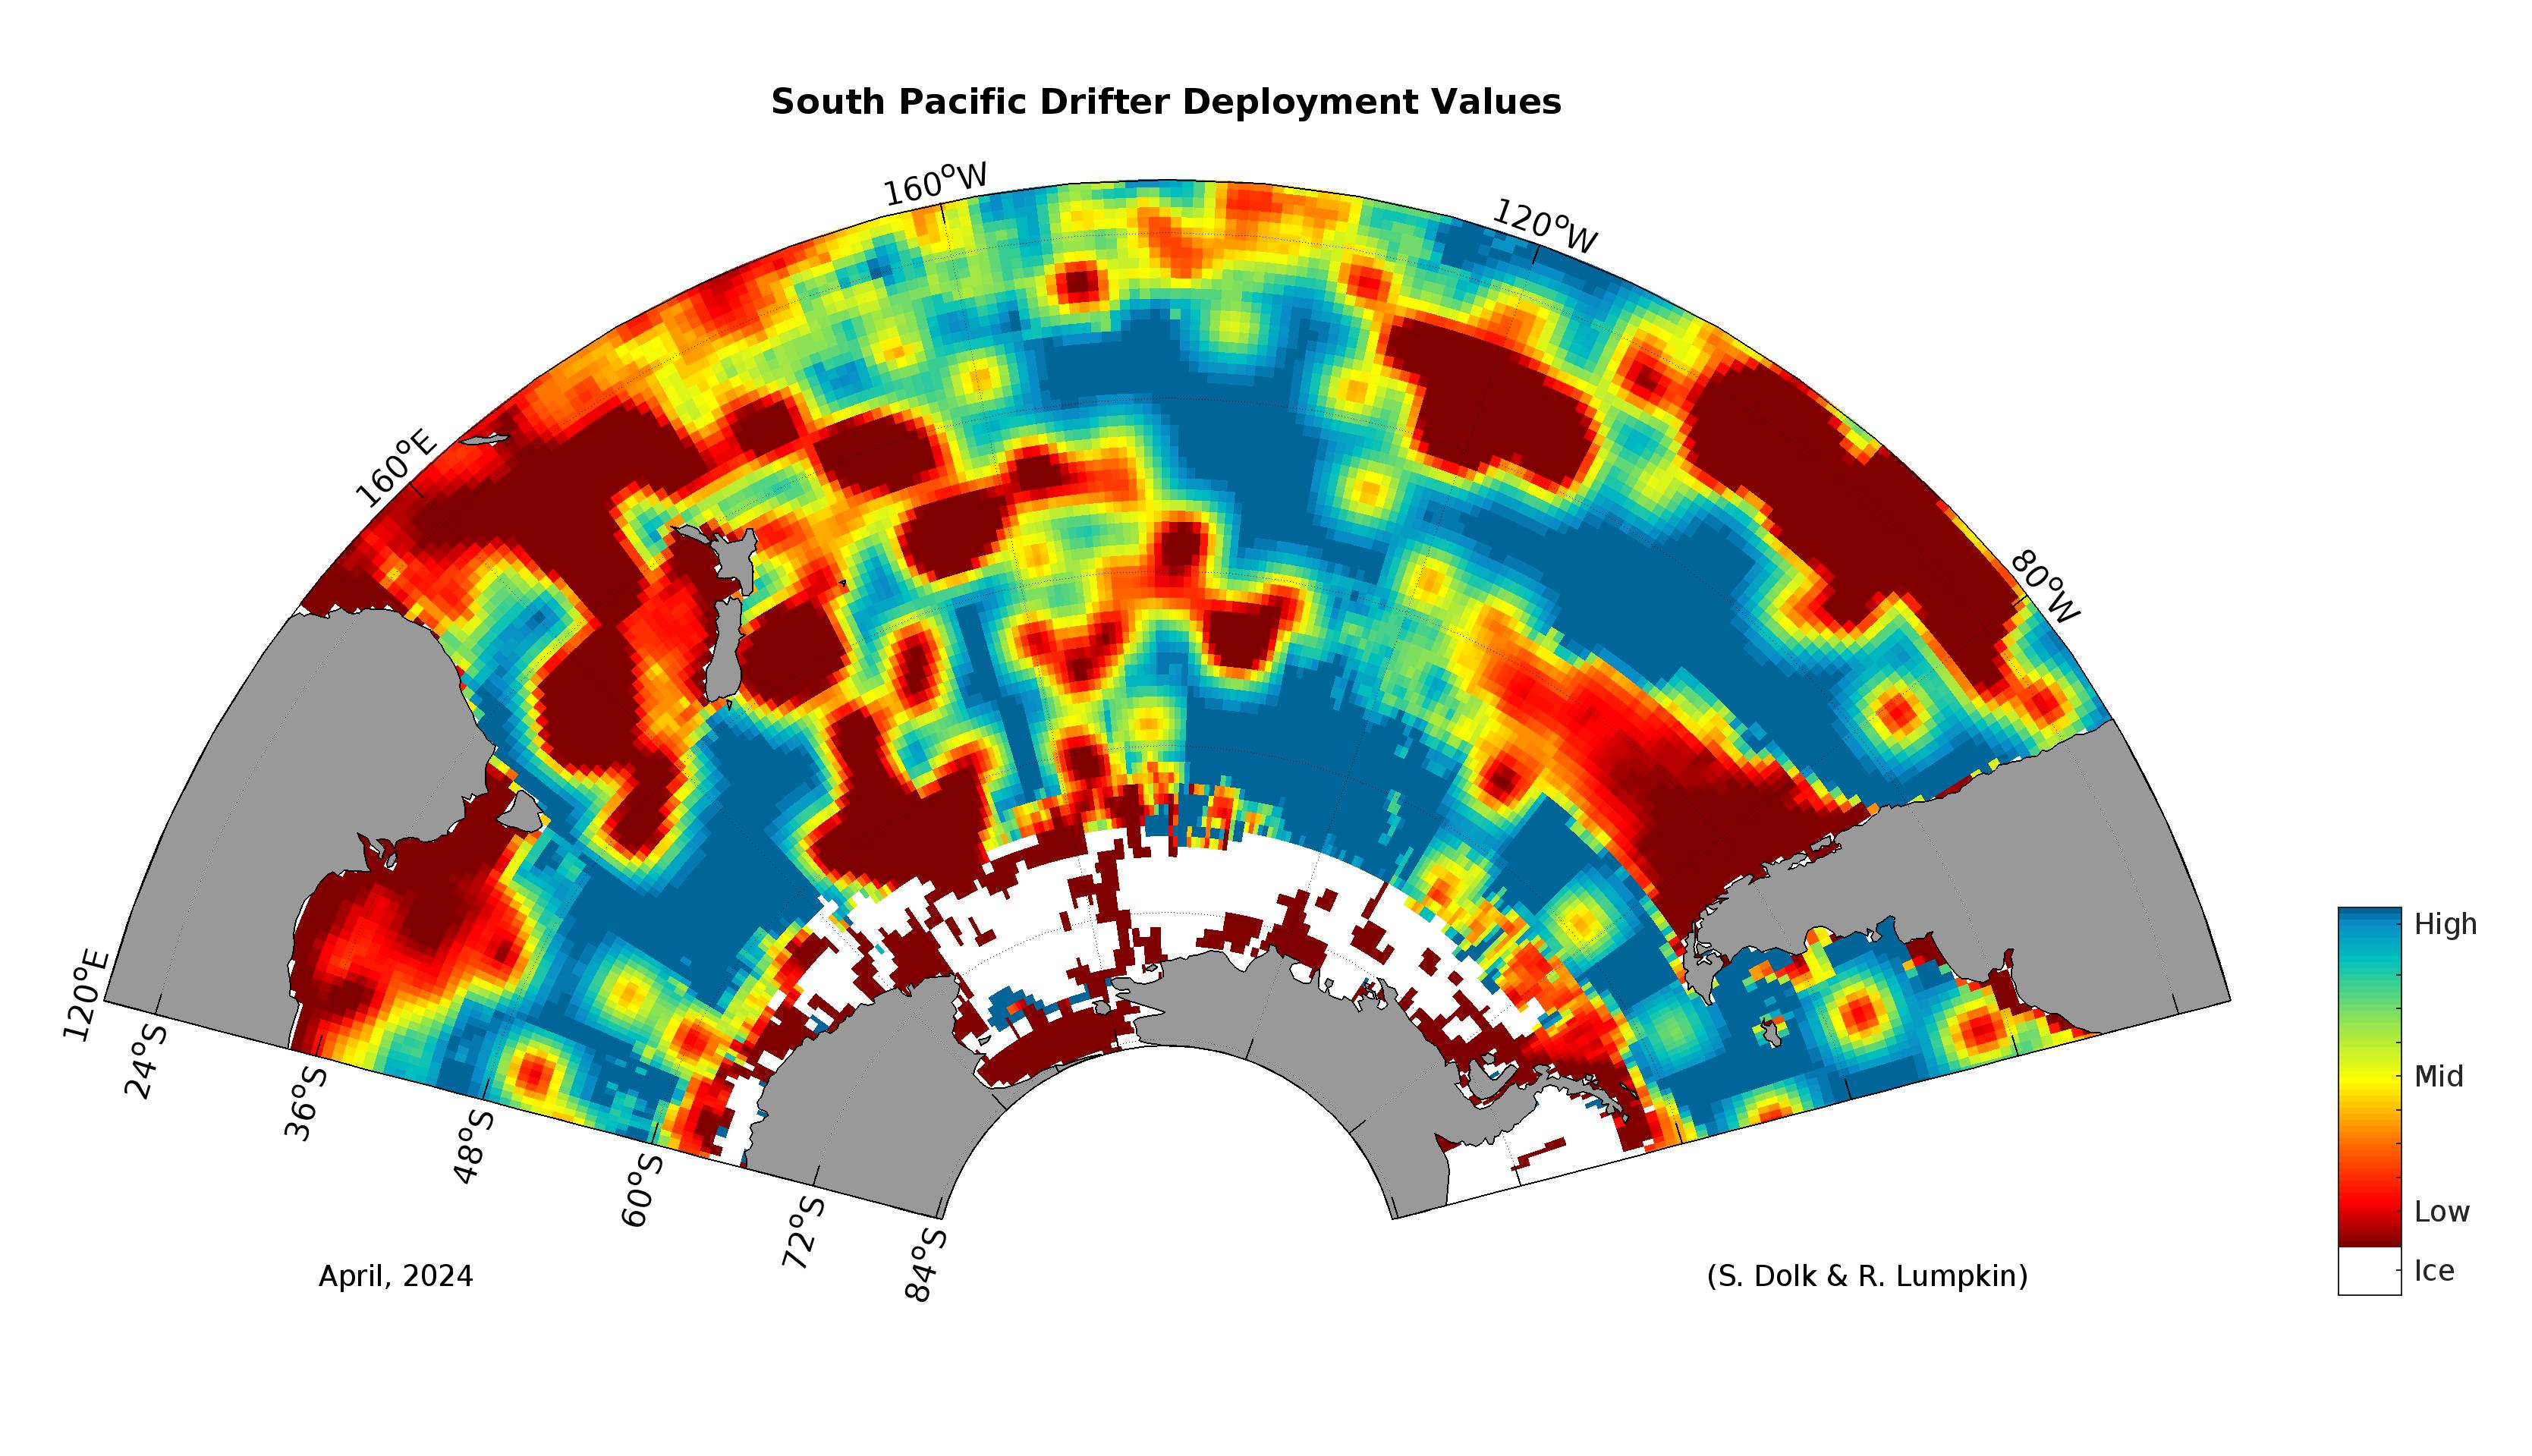
To maximize spatial drifter coverage the Global Drifter Program created a set of Drifter Deployment Value Maps which are used throughout the community to identify the highest value deployment locations. Since drifters are shipped via ocean freight, it can take two weeks to four months to ship a drifter, depending on the destination.
View the maps below, or download our drifter deployment value text file, which shows values by latitude and longitude.
Regional Value Maps
Note: NaN values have been replaced with 999, while closed basis, areas shallower than 25m, and ice-covered regions are designated with a zero value.
The Arctic
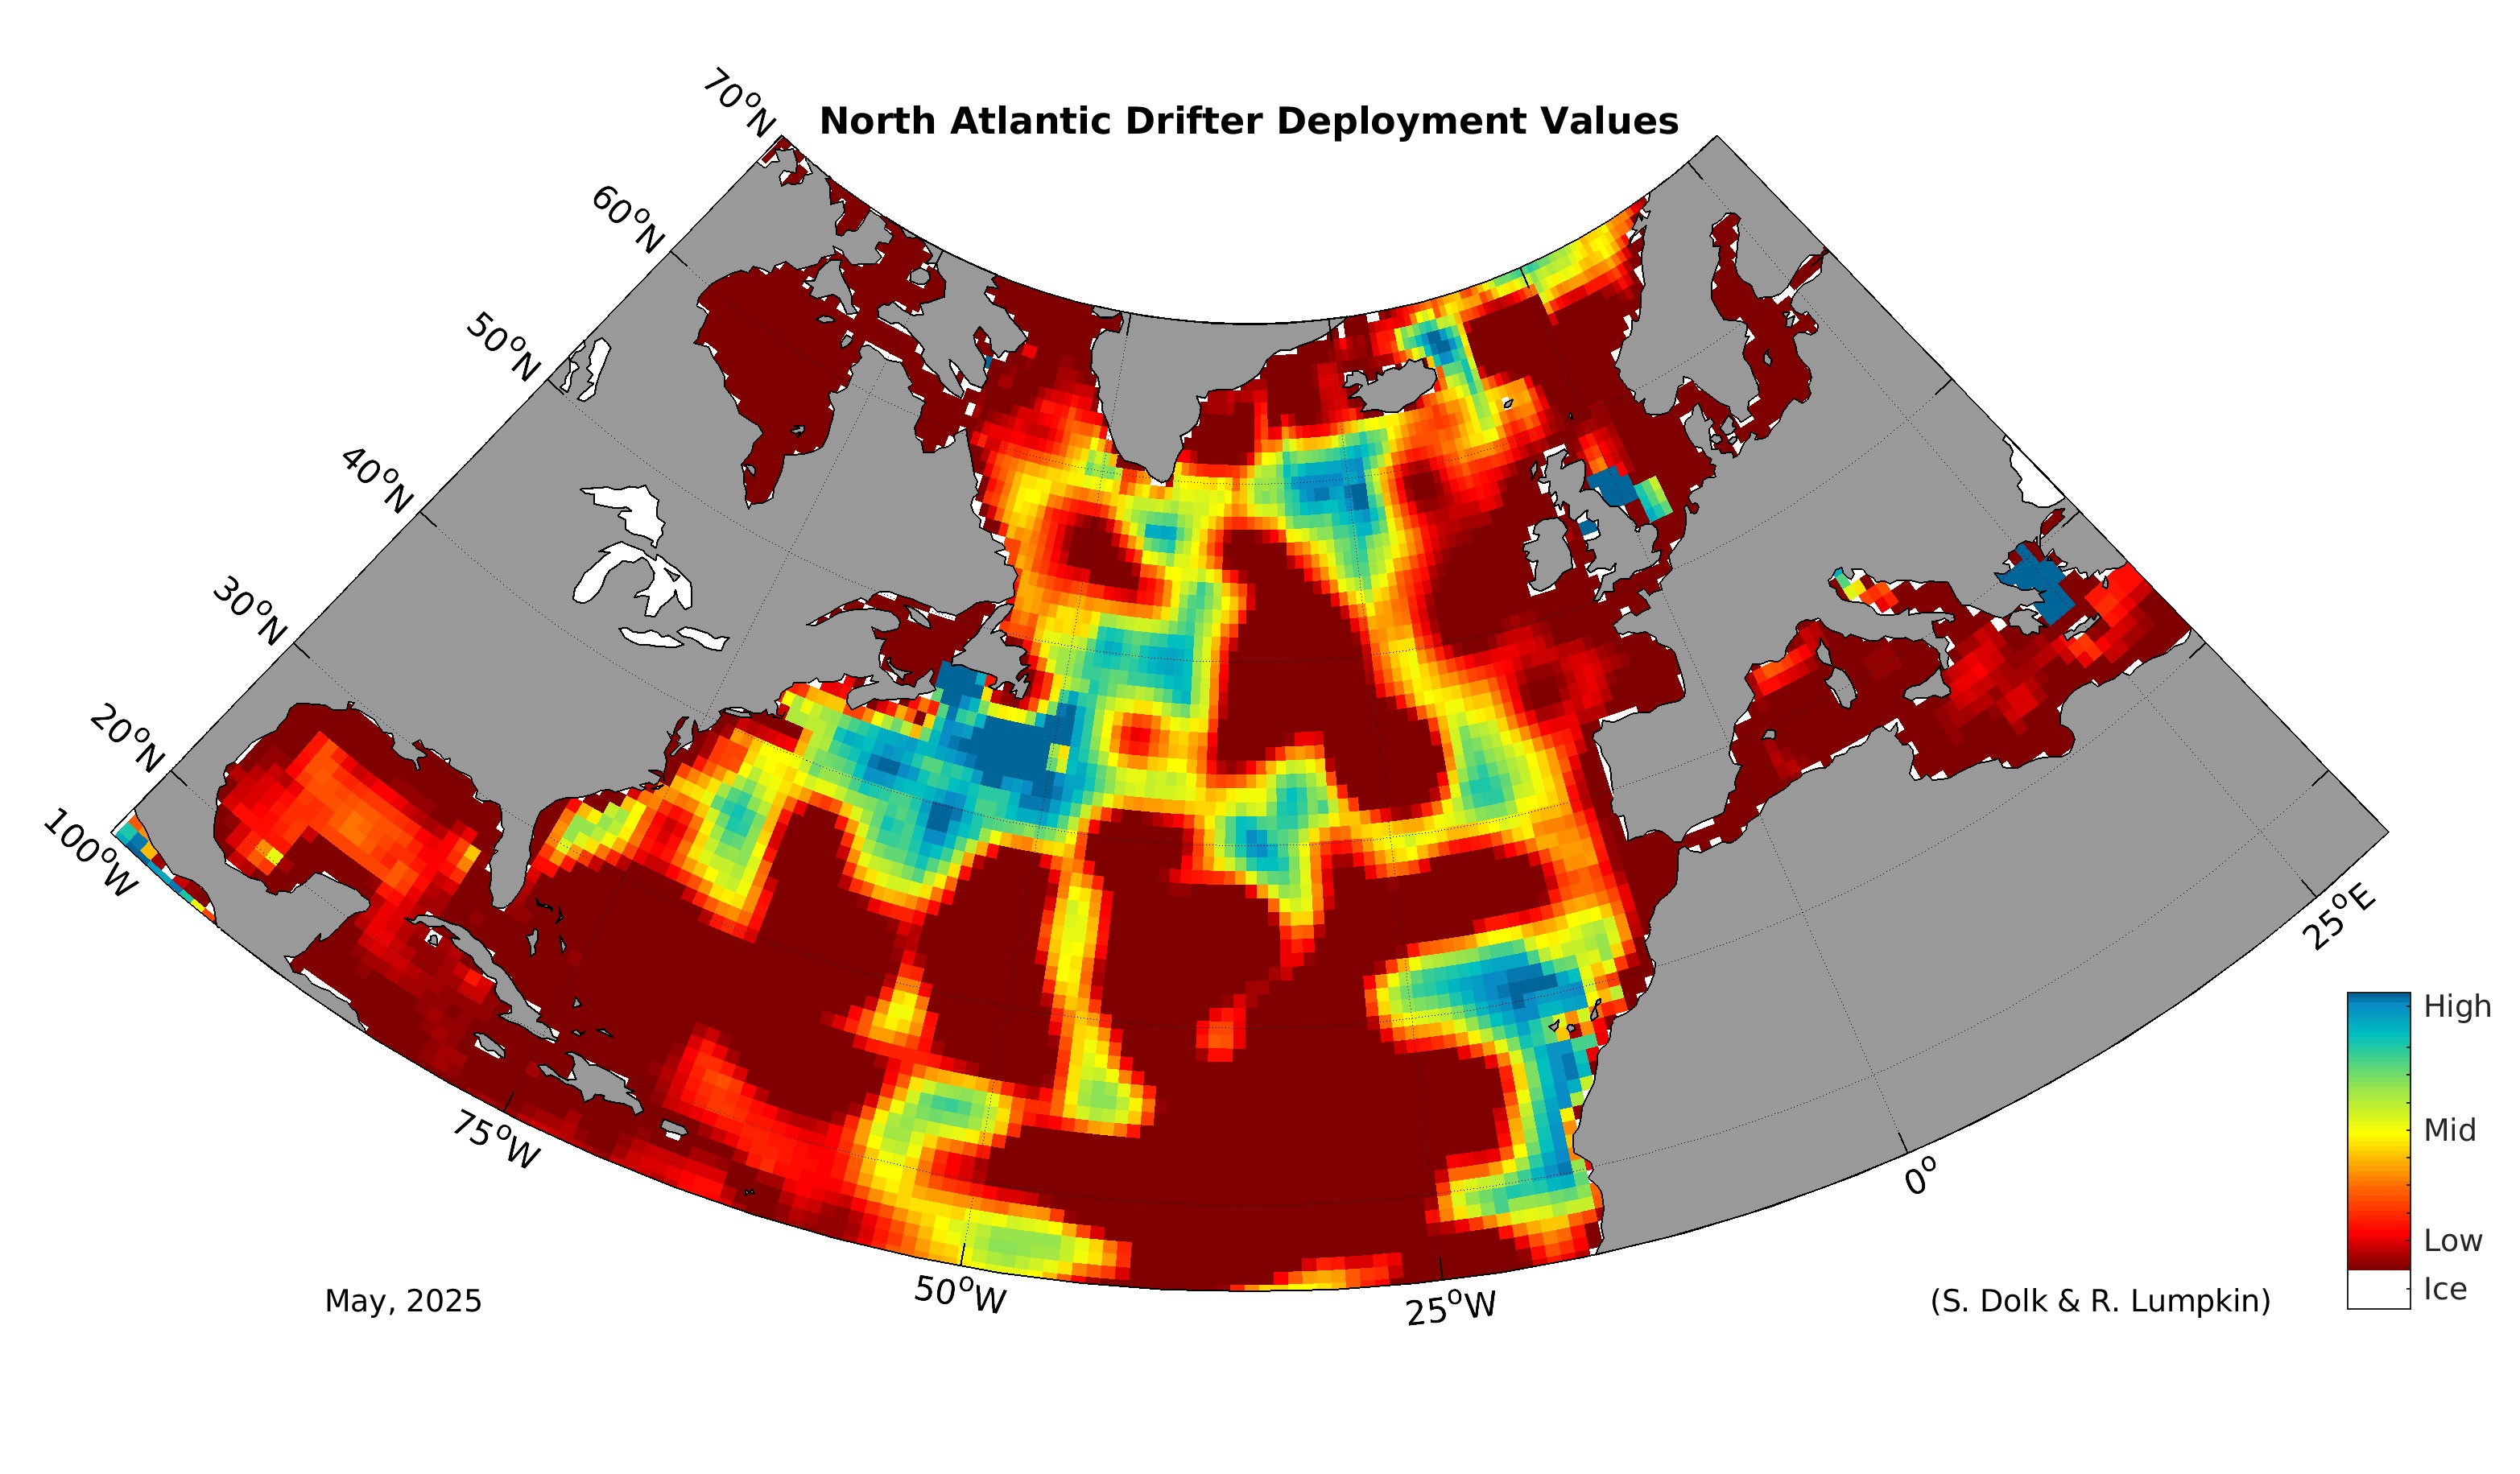
The North Atlantic
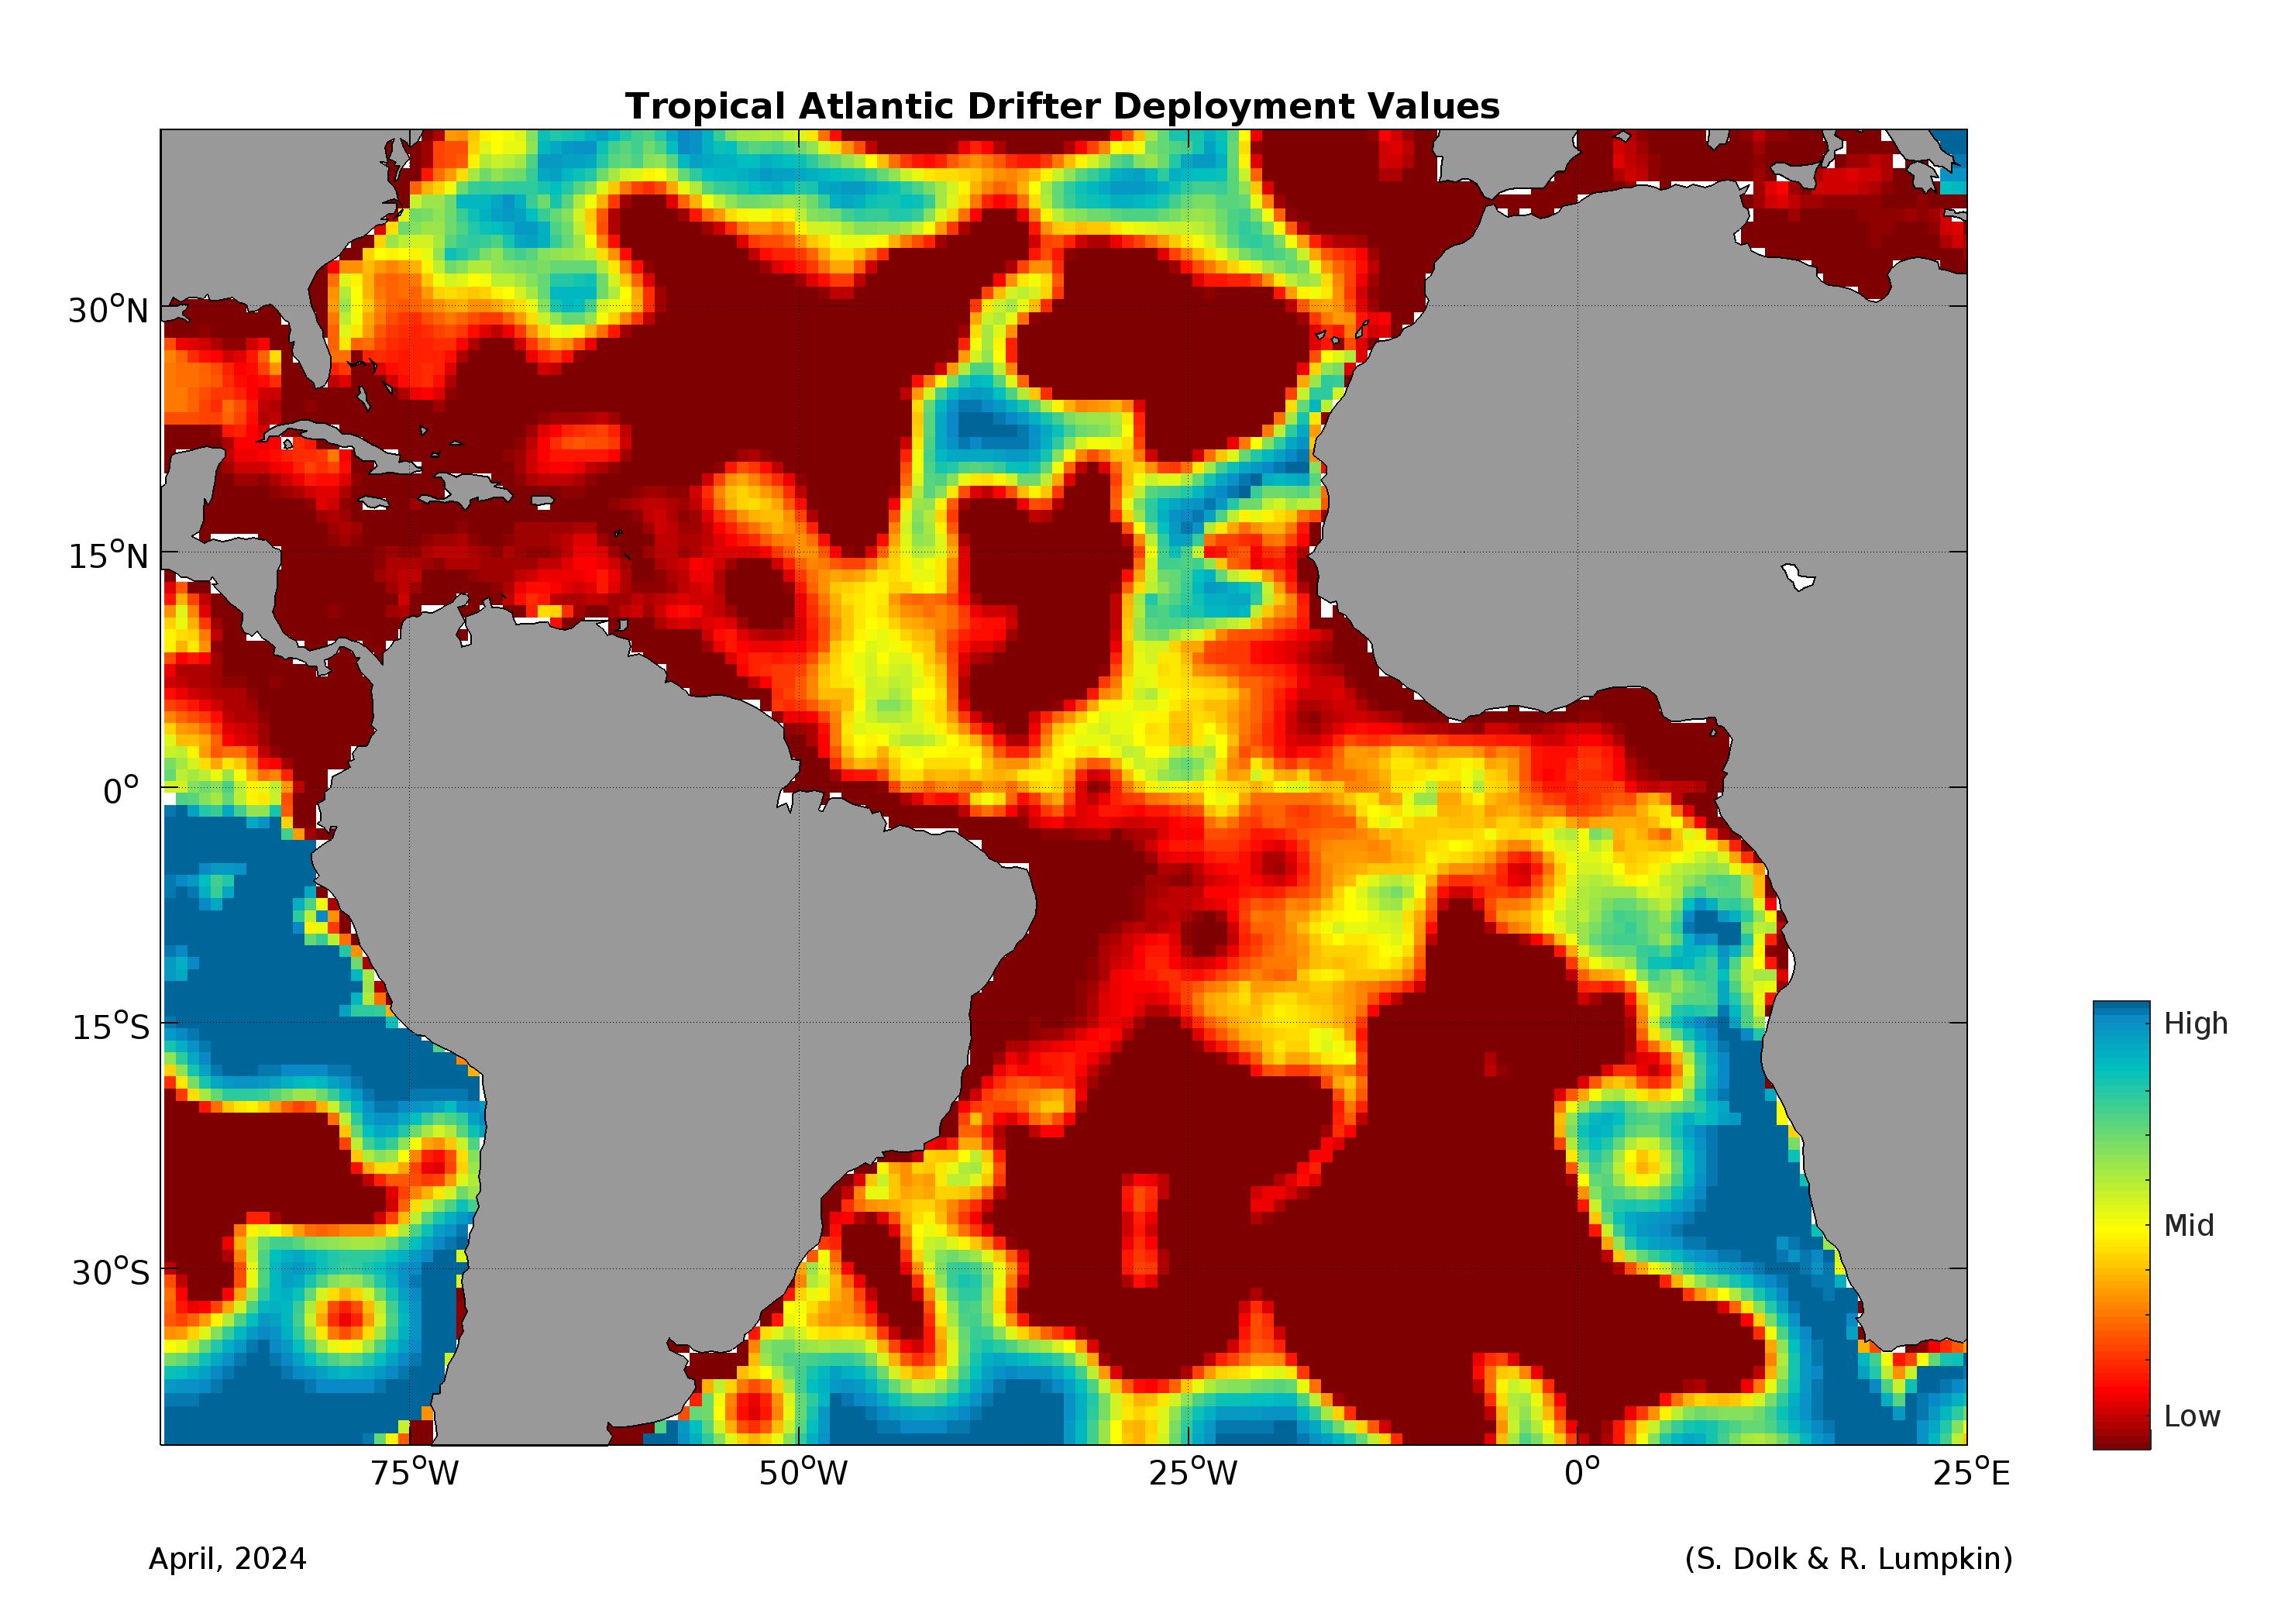
The Tropical Atlantic
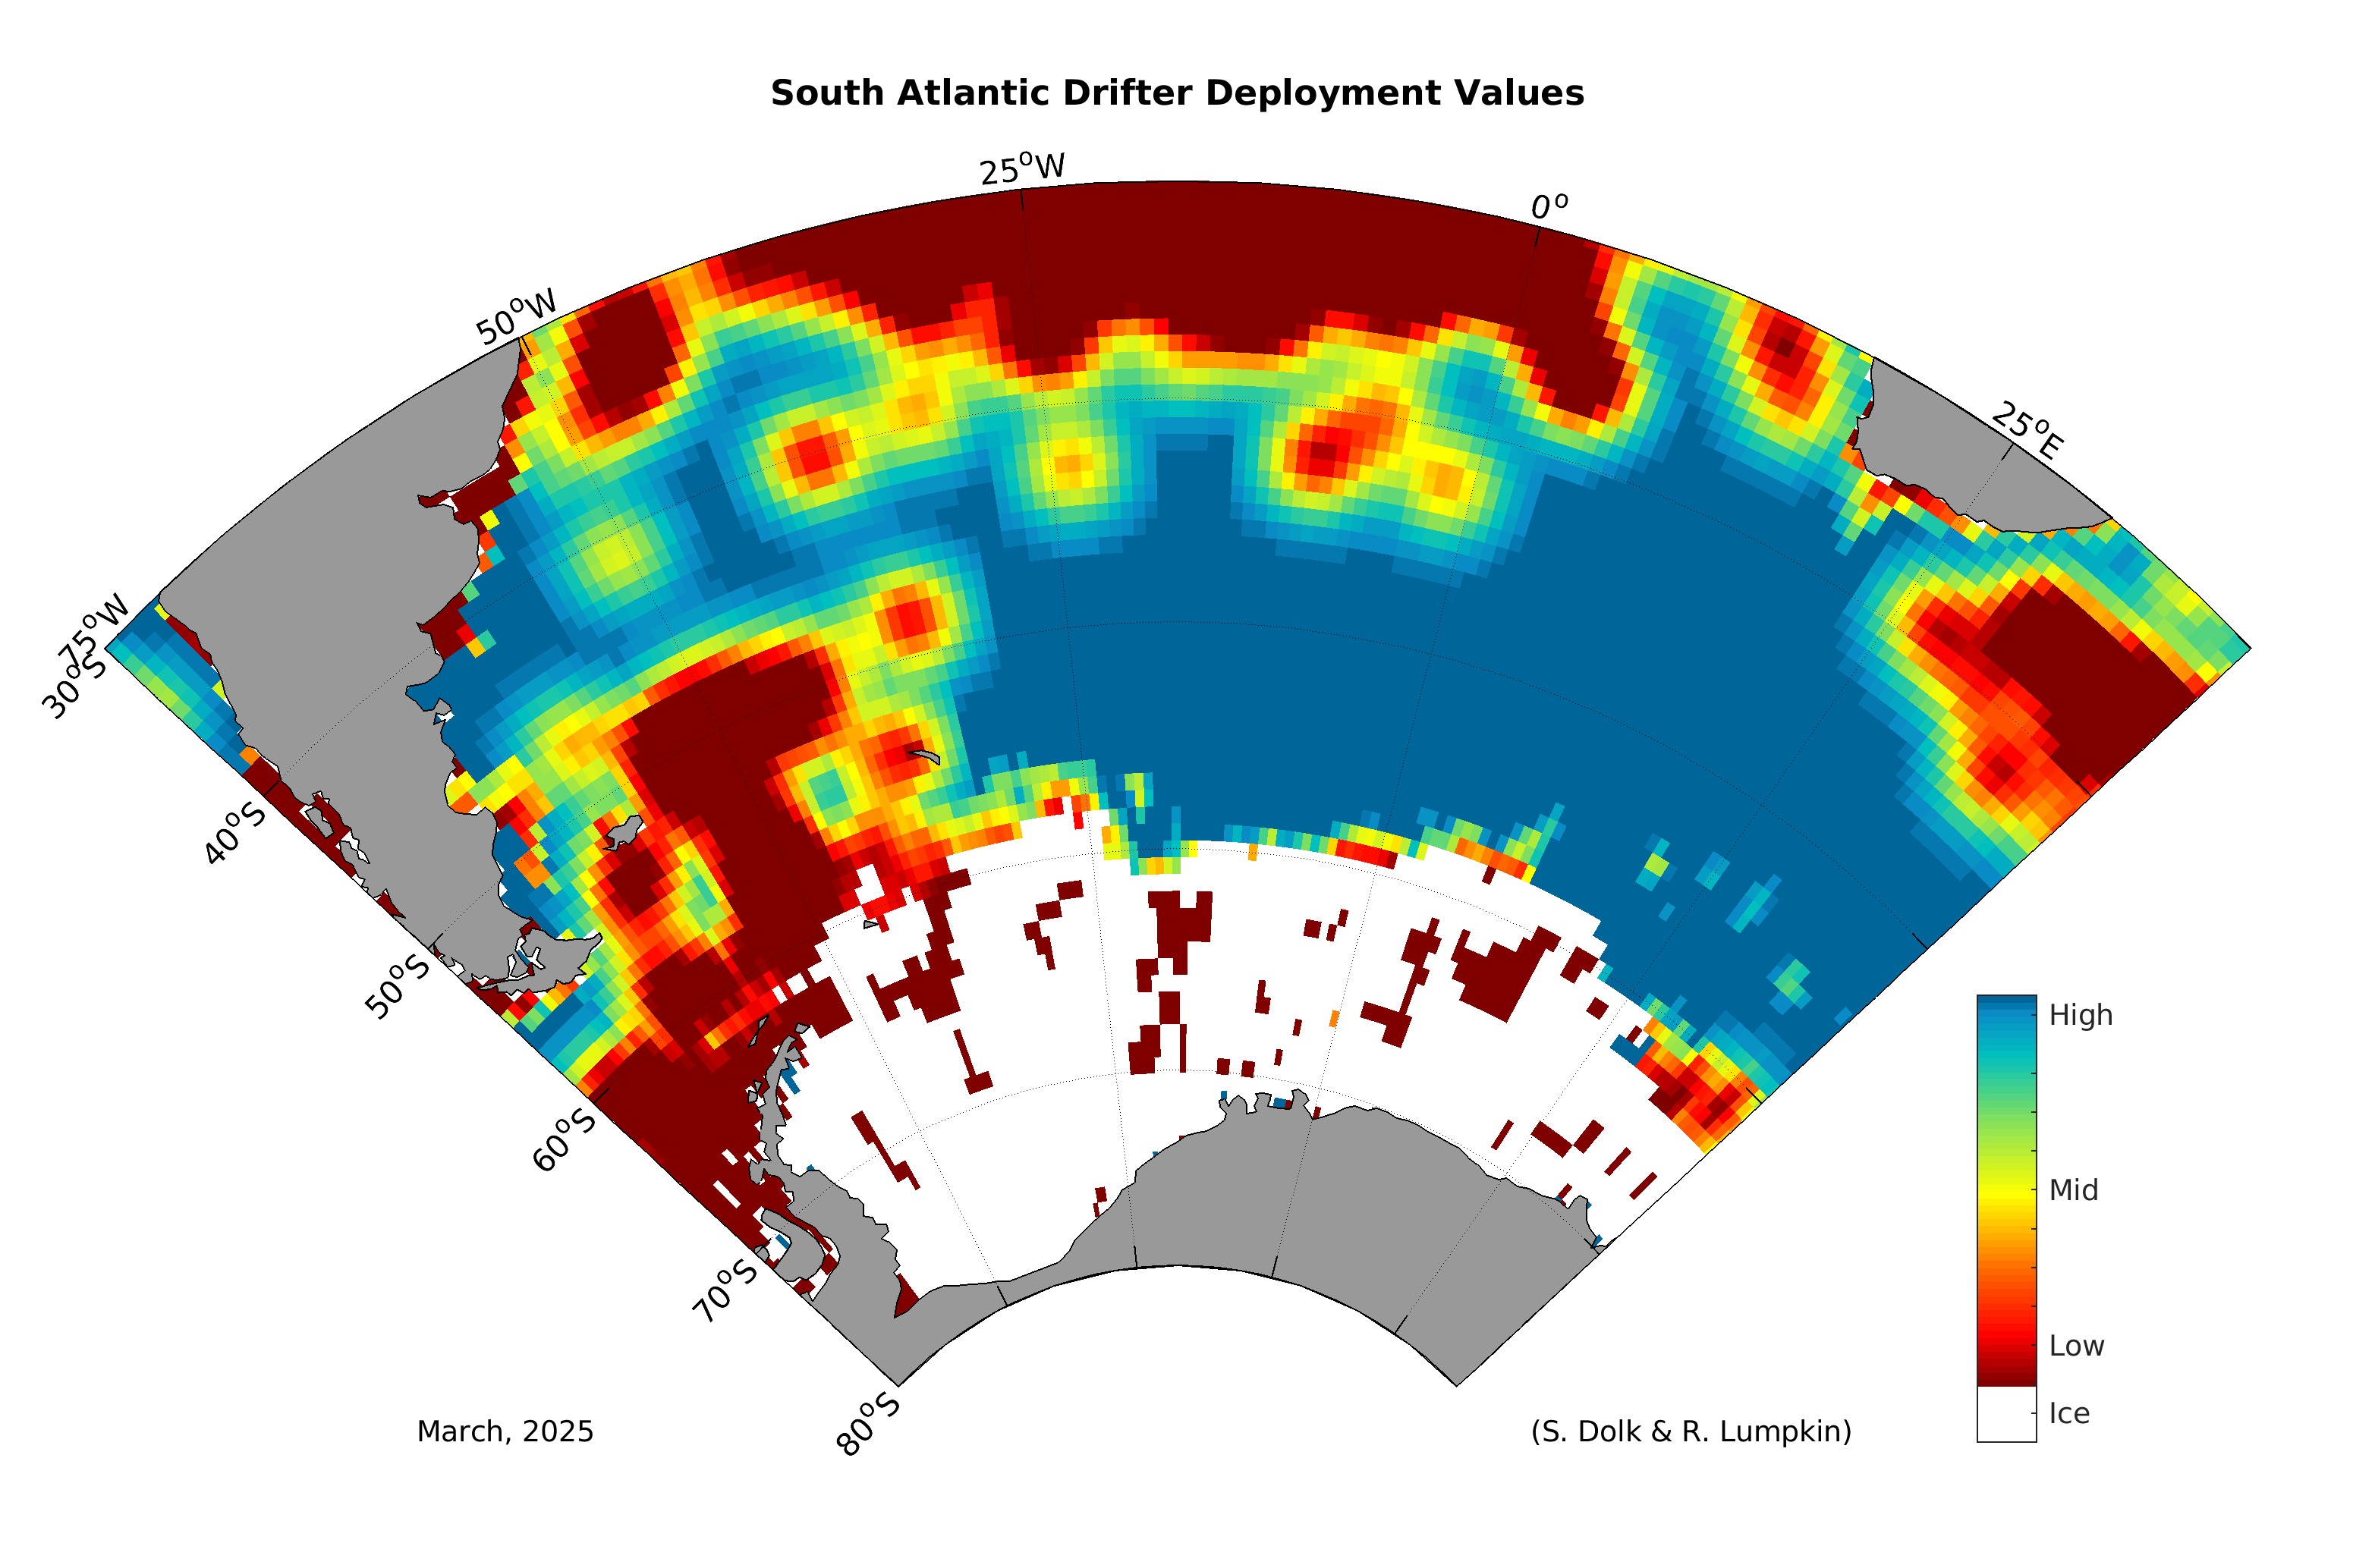
The South Atlantic
The Indian Ocean
The North Pacific
The Equatorial Pacific
The South Pacific
We are strong because of our community.
Deploy Your Own Drifter.
Deployments can be reported by clicking report deployment or by emailing drifter.deployment@noaa.gov.
Adopt a Drifter Program
Drifters Teach Kids about Ocean Currents
Global Ocean Monitoring and Observing Program established the Adopt a Drifter Program in December 2004 for K-16 teachers from the United States along with international educators. This free program provides teachers with an educational opportunity to infuse ocean observing system data into their curriculum.
Participating teachers develop lesson plans to encourage their students to analyze and apply the drifting buoy data. Students in the teachers’ classes receive a drifter tracking chart to plot the coordinates of the drifter as it moves freely in the surface ocean currents. This enables teachers and students to more easily make connections between the drifter data maps accessed online and other maps showing currents, winds, and other factors.

Outreach Partnerships

The Ocean Race
Since 1973, competitors aboard world class sailing vessels have circumnavigated the globe during the Ocean Race (formerly known as the Volvo Ocean Race). While competition is fierce and victory is the ultimate goal, these competitors are generating legacies greater than their performance on the water. Race coordinators and competitors have worked tirelessly to incorporate scientific advancements and increase oceanographic and atmospheric data acquisition, including the deployment of drifting buoys.
International SeaKeepers Society
The Global Drifter Program is working with private vessel owners to deploy drifting buoys throughout the worlds oceans. The International SeaKeepers Society promotes oceanographic research, conservation, and education through direct involvement with the yachting community.
Semester at Sea
The MV World Odyssey is the Semester At Sea campus. Outfitted as a globe-exploring university, the MV World Odyssey is a living-learning community that provides a platform for discussion, coursework and deep connections all while traveling to new locations. During these voyages, the Semester At Sea and the Global Drifter Program have partnered to deploy drifters throughout the worlds oceans.
Driving Innovative Science with Data
The array of global drifters has created a vast network of time-series data about our oceans and how they move. This data has been used all over the world to study ocean basins, seas, and ocean features. Drifters are ideal for studying surface dispersion of any buoyant particles (such as fish larvae, oil spills, or marine debris) and for looking at how small ocean features contribute to the movement of larger ones. In addition, real-world drifter data has been used by scientists to improve the physics of water movement in ocean models.
Scientists do this by using real-world drifter observations to improve model accuracy. Temperature data from drifters has been used by scientists to study ocean processes, such as the heat content in the equatorial Pacific and how it impacts the equatorial cold-tongue of El Nino. Lastly, by combining drifter observations with satellite altimetry, some researchers have been able to produce topographical maps of ocean sea surface height over a set of years.
“On an impact per observation basis, drifter observations are the most valuable contribution of the entire ocean observing system to improving weather forecasts”

Real-Time Data
Real time drifter data are distributed on the Global Telecommunication System for improved weather forecasting and ocean state estimation. On this page, we provide instructions on how to obtain these Global Telecommunication System data streams using NOAA’s Observing System Monitoring Center.

6-Hour Interpolated Data
The Drifter Data Assembly Center at AOML applies quality control procedures to edit drifter data (position and temperature) and interpolates them to 6-hour intervals as described in Hansen and Poulain (1996). These data are ideal for climate research and span the period February 1979 to the most recent quality-controlled data.

Hourly Data
These data are quality controlled and interpolated to hourly positions as described in Elipot et al. (2016), and are ideal for studying high-frequency motion. They are a subset of the 6-hourly data, as most drifter data before 2005 were too coarse to interpolate to hourly values.
Drifter Data Frequently Asked Questions
Who uses drifter data?
- Primarily oceanographers, meteorologists, and climatologists deploy and utilize drifter data. However, because drifter data can be used to track oil spills, marine debris, larval fish dispersion, etc. there is a growing list of deploying partners and data consumers.
- Oceanographic and climate researchers analyze the data to find aspects of the data that can be applied to other observations or explain phenomena.
- In an effort to better educate K-12 students about the importance of the ocean and how drifters provide invaluable data, the GDP works closely with NOAA’s Adopt a Drifter Program. Through the Adopt a Drifter Program, the GDP encourages young scientists how to access drifter data and its many applications.
What is a data fix?
While possible to increase/decrease the time interval between data transmissions, the standard transmission rate for drifting buoys is one transmission per hour, at the top of each hour. A fix is when a satellite receives a particular transmission and relays it to a land-based data center.
What is kriging?
Kriging is an optimum interpolation procedure which is commonly used for two and three-dimensional analyses. It is the method used at the drifter Data Assembly Center to interpolate (fill in the gaps in the data) and make them equally spaced into six hour intervals.
See Hansen, D.V. and Poulain, P.M., 1996, [PDF] for a complete description of the quality controlled and interpolation procedures applied to the drifter data in this database.
What is a Weighted Maximum Likelihood Estimate (WMLE)?
WMLE is an optimized model for the most likely location of a drifter given an estimate and a known error range. It is the method used at the drifter Data Assembly Center to interpolate (fill in the gaps in the data) and make them equally spaced into hourly intervals.
For more information, see Elipot et al. (2016) [PDF].
What is the difference between drifter ID numbers and World Meteorological Organization (WMO) numbers?
WMO numbers are used when the data is transmitted on the Global Telecommunications System for weather forecasting models, and in the past were reused. Drifter ID numbers are unique to each drifter and are not reused.
How and when are WMO numbers assigned?
WMO numbers are assigned after the deployment region is identified. WMO numbers are seven digit numbers used to reference data placed onto the Global Telecommunication System (GTS), for public distribution and archive. The first two digits of the WMO number correspond to the deployment region, which can be found on the map below.

Where do you find a WMO number for a particular drifter?
Where do you find a WMO number for a particular drifter?
WMO numbers can be found in two places.
- If you already know the ID number of your particular drifter(s), please utilize the table found at:
aoml.noaa.gov/phod/dac/wmoid. - To find drifters within a specific region, or timeframe, please reference the GDP Directory File, at:
aoml.noaa.gov/phod/dac/dirall.
-
- The WMO number is shown in the second column, immediately to the right of the corresponding ID number.
Where do I find drifter data and how much does it cost?
- Happily, the drifter data is FREE and accessible to the public, courtesy of NOAA’s Climate Program Office!
- Drifter data are quality controlled and stored at AOML’s Drifter Data Assembly Center, then sent to Canada’s Marine Environmental Data Service for archiving and public distribution.
- For links and instructions to access real-time drifter data, please visit
aoml.noaa.gov/phod/gdp/real-time_data - For quality controlled interpolated drifter data, please visit
aoml.noaa.gov/phod/gdp/interpolated/data/all.
Where do I find real-time drifter data?
- Links and instructions to access real-time drifter data, can be found at aoml.noaa.gov/phod/gdp/real-time_data.
How do I search for drifter data at a specific time and/or location?
- To search for real-time drifter data by specific time and location, visit
aoml.noaa.gov/phod/gdp/real-time_data. - To search for interpolated data by specific time, location and/or ID #, visit
aoml.noaa.gov/phod/gdp/interpolated/data/all. - To download the entire hourly drifter dataset, visit
aoml.noaa.gov/phod/gdp/hourly_data.
How often is the quality-controlled drifter database updated?
- The quality controlled drifter data is updated every 2-3 months. Therefore quality controlled drifter data is available delayed mode, with notifications of these updates found at aoml.noaa.gov/phod/gdp.
How do I download the entire quality-controlled drifter database?
- Drifter data can be downloaded from ftp://ftp.aoml.noaa.gov/pub/phod/buoydata.
Where do I find metadata files, with details about the drifters?
- Several files containing different kinds of metadata information are available on the web:
From the GDP Home page, select Global Drifter Program at the top of the screen, then navigate to Metadata. From there, you will find several options to choose from. Direct links are found below:- Drifter Deployment Information:
aoml.noaa.gov/phod/dac/deployed - Quality Controlled Metadata:
aoml.noaa.gov/phod/dac/dirall - Drifter Death Probabilities:
aoml.noaa.gov/phod/dac/drifter_deaths
- Drifter Deployment Information:
Hardware metadata are available at:
- Drifter Specifications:
aoml.noaa.gov/phod/dac/Drifter_Specifications - Barometer Specifications:
aoml.noaa.gov/phod/dac/Barometer_Metadata - Drogue Specifications:
aoml.noaa.gov/phod/dac/Drogue_Specifications
What is oldest drifter data available?
- The Global Drifter Program was established in 1979. While it took several decades to develop the program and reach its current state, with roughly 31,200 transmissions per day, the first drifter to transmit data was deployed on February 14, 1979.
How do I determine if a drifter has lost its drogue? Why is this important?
Determining drogue presence is vitally important, as this component of the drifter is what allows researchers to measure ocean current velocities at 15 meters depth. Without the drogue, which is centered at 15m, wind plays a greater roll in transporting drifters.
For this reason, AOML’s Data Assembly Center spends a tremendous amount of time and resources to pinpoint exactly when, and where, each drifter loses its drogue.
While sensor failures are identified and listed within the quality controlled dataset, you can determine real-time sensor functionality by using the WMO number from a particular drifter and visiting meteo.shom.fr/qctools.
An example of a drifter that has lost its drogue is shown in the figure below. Notice, the amount of strain on the lower hull of the surface float decreases significantly after drogue loss. At the same time, the time to first fix (how long it takes to acquire a GPS location fix) decreases significantly because the drogue is no longer pulling the surface float underwater with each passing wave.

How do I determine if the sea surface temperature sensor has failed?
All drifters are equipped with a sea surface temperature sensor at the base of the surface float.
While sensor failures are identified and listed within the quality controlled dataset, you can determine real-time sensor functionality by using the WMO number from a particular drifter and visiting meteo.shom.fr/qctools.
An example of a failed sea surface temperature sensor is shown in the figure below. Notice, the structured diurnal pattern becomes erratic and irregular on Aug. 4th, 2015.


How do I determine if the barometric pressure sensor has failed?
While not all drifters are equipped with barometric pressure sensors, nearly half of the global drifter array measures sea-level pressure, which feeds into weather forecasting models.
While sensor failures are identified and listed within the quality controlled dataset, you can determine real-time sensor functionality by using the WMO number from a particular drifter and visiting meteo.shom.fr/qctools.
An example of a failed pressure sensor is shown in the figure below. Notice, the slight pressure fluctuations begin on August 4th, 2015, then the sensor experiences complete failure on August 6th, 2015.
Drifter Recovery
Did you find a drifter?
If you find a drifting buoy, please contact a member of the Global Drifter Program with the information listed on the surface float. If the drifter remains active, with functional batteries and operational sensors, we’ll attempt to have the drifter re-deployed.
If the batteries and/or sensors are no longer operational, the drifter can be disposed of. Drifters contain no hazardous material, so simply dispose of the drifter as you would any other alkaline battery product.
Drifter ID#26028
The longest lasting drifter on record transmitted for 10 years, 4 months, and 21 days.
10.3
YEARS
124
MONTHS
3792
DAYS
Featured Publication

Van Sebille, E., Zettler, E., Wienders, N., Amaral-Zettler, L., Elipot, S., & Lumpkin, R. (2021). Dispersion of surface drifters in the Tropical Atlantic. Frontiers in Marine Science, 7, 1243.
Abstract: The Tropical Atlantic Ocean has recently been the source of enormous amounts of floating Sargassum macroalgae that have started to inundate shorelines in the Caribbean, the western coast of Africa and northern Brazil. It is still unclear, however, how the surface currents carry the Sargassum, largely restricted to the upper meter of the ocean, and whether observed surface drifter trajectories and hydrodynamical ocean models can be used to simulate its pathways. Here, we analyze a dataset of two types of surface drifters (38 in total), purposely deployed in the Tropical Atlantic Ocean in July, 2019. Twenty of the surface drifters were undrogued and reached only ∼8 cm into the water, while the other 18 were standard Surface Velocity Program (SVP) drifters that all had a drogue centered around 15 m depth….
Read Full Paper.
Dispersion of Surface Drifters in the Tropical Atlantic
Van Sebille, E., Zettler, E., Wienders, N., Amaral-Zettler, L., Elipot, S., & Lumpkin, R. (2021). Dispersion of surface drifters in the Tropical Atlantic. Frontiers in Marine Science, 7, 1243.
Abstract: The Tropical Atlantic Ocean has recently been the source of enormous amounts of floating Sargassum macroalgae that have started to inundate shorelines in the Caribbean, the western coast of Africa and northern Brazil. It is still unclear, however, how the surface currents carry the Sargassum, largely restricted to the upper meter of the ocean, and whether observed surface drifter trajectories and hydrodynamical ocean models can be used to simulate its pathways. Here, we analyze a dataset of two types of surface drifters (38 in total), purposely deployed in the Tropical Atlantic Ocean in July, 2019. Twenty of the surface drifters were undrogued and reached only ∼8 cm into the water, while the other 18 were standard Surface Velocity Program (SVP) drifters that all had a drogue centered around 15 m depth….
Read Full Paper.

Drifter Bibliography
Driving Innovative Science with Data.
Our Contribution to Global Ocean Observing.
The following is a list of scientific publications that reference Global Drifter Program (GDP) data. If your drifter publication is not listed within, please email the Drifter Program with the complete reference.
Please contact publication authors to obtain an electronic or printed version of the articles. Alternatively, you may conduct a Google search of the publication title, which may direct you to an electronic version of the article.
View PDF list by year or alphabetically by author.

AOML Publications & References
Elipot, S., A. Sykulski, R. Lumpkin, L. Centurioni, and M. Pazos. A dataset of hourly sea surface temperature from drifting buoys. Scientific Reports, 9:567 (https://doi.org/10.1038/s41597-022-01670-2) (2022).
Lumpkin, R., F. Bringas, and G. Goni. Global oceans: Surface currents. In State of the Climate in 2021, J. Blunden and T. Boyer (eds.). Bulletin of the American Meteorological Society,103(8):S172-175 (https://doi.org/10.1175/BAMS-D-22-0072.1) (2022).
Androulidakis, Y., V. Kourafalou, M. Le Hénaff, H.-S. Kang, and N. Ntaganou. The role of mesoscale dynamics over northwestern Cuba in the Loop Current evolution in 2010, during the Deepwater Horizon incident. Journal of Marine Science and Engineering, 9(2):188 (https://doi.org/10.3390/jmse9020188) (2021).
Lumpkin, R., R. Domingues, and G.J. Goni. Global oceans: Surface currents. In State of the Climate in 2020, J. Blunden, and T. Boyer (eds.). Bulletin of the American Meteorological Society, 102(8):S172-S175 (https://doi.org/10.1175/BAMS-D-21-0083.1) (2021).
Van Sebille, E., E. Zettler, N. Wienders, L. Amaral-Zettler, S. Elipot, and R. Lumpkin. Dispersion of surface drifters in the tropical Atlantic. Frontiers in Marine Science, 7:607426 (https://doi.org/10.3389/fmars.2020.607426) (2021).
Zhao, M., R.M. Ponte, O. Wang, and R. Lumpkin. Using drifter velocity measurements to assess and constrain coarse-resolution ocean models. Journal of Atmospheric and Oceanic Technology, 38(4):909-919 (https://doi.org/10.1175/JTECH-D-20-0159.1) (2021)
Beal, L.M., J. Vialard, M.K. Roxy, M. Ravichandran, M.J. McPhaden, M. Feng, R. Lumpkin, A.S. Unnikrishnan, T. Lee, B. Sloyan, M. Andres, A.C. Subramanian, L. Yu, M. Lengaigne, T. Shinoda, H. Annamalai, C.C. Ummenhofer, P. Strutton, Y. Masumoto, T. Tozuka, J. Wiggert, W. Han, and R. Hood. InDOOS-2: A roadmap to sustained observations of the Indian Ocean for 2020-2030. Technical Report, CLIVAR-4/2019, GOOS-237 (https://doi.org/10.36071/clivar.rp.4.2019), 206 pp. (2019).
Johns, E.M., R. Lumpkin, N.F. Putman, R.H. Smith, F.E. Muller-Karger, D. Rueda-Roa, C. Hu, M. Wang, M.T. Brooks, L.J. Gramer, and F.E. Werner. The establishment of a pelagic Sargassum population in the tropical Atlantic: Biological consequences of a basin-scale long distance dispersal event. Progress in Oceanography, 182:102269 (https://doi.org/10.1016/j.pocean.2020.102269) (2020).
Le Hénaff, M., V.H. Kourafalou, Y. Androulidakis, R.H. Smith, H.-S. Kang, C. Hu, and J. Lamkin. In situ measurements of circulation features influencing cross-shelf transport around northwest Cuba. Journal of Geophysical Research-Oceans, 125(7):e2019JC015780 (https://doi.org/10.1029/2019JC015780) (2020).
Lumpkin, R., and G. Goni. Global oceans: Surface currents. In State of the Climate in 2019, J. Blunden and D.S. Arndt (eds.). Bulletin of the American Meteorological Society, 101(8):S156-S159 (https://doi.org/10.1175/BAMS-D-20-0105.1) (2020).
Miron, P., M.J. Olascoaga, F.J. Beron-Vera, N.F. Putman, J. Trinanes, R. Lumpkin, and G.J. Goni. Clustering of marine debris- and Sargassum-like drifters explained by inertial particle dynamics. Geophysical Research Letters, 47(19):e2020GL089874 (https://doi.org/10.1029/2020GL089874) (2020).
Olascoaga, M.J., F.J. Beron-Vera, P. Miron, J. Trinanes, N.F. Putman, R. Lumpkin, and G.J. Goni. Observation and quantification of inertial effects on the drift of floating objects at the ocean surface. Physics of Fluids, 32(2):026601 (https://doi.org/10.1063/1.5139045) (2020).
Partners
Sharing Resources Delivers Results.
Expanding Reach Through Partnerships.
26
Countries
Countries collaborating with AOML to deploy drifters for the Global Drifter Program
696
Drifters
Drifters currently deployed by partnering international organizations.


More National & International Partners
Together with partners around the world, the GDP deploys nearly 1,000 drifters per year, throughout the world’s oceans. While not a complete list of GDP partners, below is a list of key contributors:
Argentina
Australia
Brazil
Canada
Chile
France
Institut Fracais de Recherche Pour I’exploitation de la Mer (IFREMER)
Gabon
Hong Kong
India
Italy
Japan
Kenya
Republic of Korea
Mexico
New Zealand
South Africa
Spain
United Kingdom
United States
Massachusetts Maritime Academy (MMA)
NOAA National Data Buoy Center (NDBC)Office of Naval Research (ONR)
Oregon State UniversityNOAA Pacific Marine Environmental Laboratory (PMEL)
Scripps Institution of Oceanography
International Collaborators
Key Accomplishments
OceanObs’19 held in Honolulu, HI, with goal to improve governance of the Global Ocean Observing System by improving advocacy, funding, and alignment with best practices.
September 2019
Deployment of 25,000th GDP drifter, from a sailing ship of The Ocean Race (formerly Volvo Ocean Race).
May 2018
The Global Drifter Program created and distributed deployment value maps, which clearly communicate where drifters are needed to be deployed to maximize their value.
July 2013
The drifter Data Assembly Center at AOML completed a systematic reevaluation of drogue presence for all of the drifters in the historical data base. Before this, a large fraction of the drifters did not have correct drogue loss dates due to problems with the drogue detection sensor.
July 2012
Death of professor Peter Niiler, creator of the Global Drifter Program
October 2010
Deployment of 36 drifters in the Gulf of Mexico in response to the Deepwater Horizon disaster.
June 2010
OceanObs’09 held in Venice, Italy; community vision expressed for the Global Ocean Observing System.
September 2009
Deployment of 21 drifters in front of hurricanes Gustav and Ike to measure air-sea interactions during passage of a major hurricane.
August-September 2008
The Global Drifter Program becomes the first completed component of the Global Ocean Observing System with the deployment of drifter #1250.
September 2005
OceanObs’99 held in St. Raphael, France; vision of a global array of 1250 drifters proposed by Peter Niiler.
October 1999
The first deployment of drifters in an effort that will evolve into the Global Drifter Program.
1979