LGBTQ Nondiscrimination Protections
More than three in four Americans (76%) favor laws that would protect lesbian, gay, bisexual, and transgender Americans from discrimination in jobs, housing, and public accommodation. Less than one in five Americans (19%) oppose nondiscrimination protections for LGBT Americans. Around one-third of Americans strongly favor nondiscrimination protections (34%), compared to less than one in ten who strongly oppose them (6%).
Majorities of nearly every subgroup of Americans favor LGBT nondiscrimination protections, across race, age, religious, and partisan lines.
The present level of support is higher than any PRRI has recorded in previous years, and is a significant increase from 2019, when 72% of Americans favored nondiscrimination protections for LGBT Americans. Prior to 2019, support for nondiscrimination protections hovered around seven in ten Americans: 69% in 2018, 70% in 2017, 72% in 2016, and 71% in 2015.
The increase in support for LGBT nondiscrimination protections since 2015 has largely come among Americans of color and white mainline Protestants. White mainline Protestants and Black Americans have grown 10 percentage points more likely to favor nondiscrimination protections for LGBT Americans from 2015 to 2020 (from 73% to 82% and 65% to 75%, respectively). Multiracial Americans (from 72% to 81%), Black Protestants (from 64% to 73%), Americans ages 30 to 49 (from 73% to 81%), independents (from 73 to 78%), and Democrats (from 78% to 85%) have all become more likely to favor protections than they were in 2015.
Party Affiliation
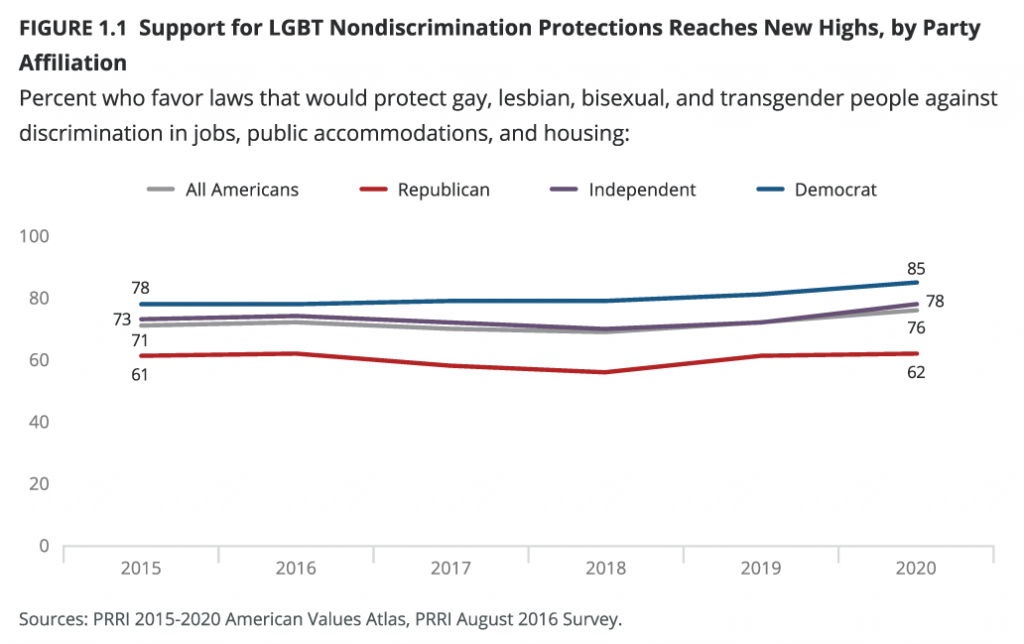
Majorities of all partisan groups favor LGBT nondiscrimination protections, but Democrats (85%) and independents (79%) are more likely than Republicans (62%) to favor protections.
Support for LGBT nondiscrimination protections among Democrats remained relatively steady in 2015 (78%), 2017 (79%), and 2018 (79%), before rising slightly in 2019 (81%) and 2020 (85%). Support among independents was also relatively steady: Around seven in ten favored protections in 2015 (73%), 2017 (72%), 2018 (70%), and 2019 (72%), and increased to 78% in 2020. Republican support declined slightly, from 61% in 2015 to 58% in 2017 and 56% in 2018, before climbing back to 61% in 2019 and 62% in 2020.
Unsurprisingly, liberal and moderate partisans are more likely than their conservative counterparts to favor LGBT nondiscrimination protections. Liberal (73%) and moderate (75%) Republicans are more likely than conservative Republicans (59%) to support nondiscrimination protections. Independents exhibit a similar pattern: Liberal (86%) and moderate (81%) independents overwhelmingly favor nondiscrimination laws, while a slightly smaller majority of conservative independents say the same (69%). More than seven in ten conservative Democrats (73%), compared to more than eight in ten moderate Democrats (83%) and nine in ten liberal Democrats (91%) favor protections for LGBT Americans.
Younger partisan groups are more likely than their older counterparts to support nondiscrimination protections. Seven in ten or more Republicans (70%), independents (84%), and Democrats (89%) under age 50 support nondiscrimination protections. Support is lower among Republicans (56%), independents (71%), and Democrats (81%) over age 50.
Across the partisan spectrum, women are more likely than men to favor nondiscrimination protections for LGBT Americans; however, there is only a small gender gap among Democrats. More than two-thirds of Republican women (68%), compared to 57% of Republican men, favor protections. Independent women (82%) are more likely than independent men (75%) to favor protections. The gender gap between Democratic women (87%) and Democratic men (83%) is minimal.
Age
Americans ages 18 to 29 (83%) and ages 30 to 49 (81%) are more likely than those ages 50 to 64 (72%) or over age 65 (65%) to favor LGBT nondiscrimination protections. The age gap between Americans ages 18 to 29 and those ages 30 to 49 has steadily closed over the past several years. In 2015, 80% of Americans ages 18 to 29 favored nondiscrimination protections, compared to 73% of those ages 30 to 49. That seven-percentage-point gap shrank to just two points in 2020, and the present difference between the two groups is not statistically significant.
Race and Ethnicity
Majorities of every racial and ethnic group favor nondiscrimination protections for LGBT Americans. Multiracial Americans (81%) and Asian and Pacific Islander Americans (AAPI) (79%) are most likely to favor nondiscrimination protections, followed closely by Hispanic Americans (77%), white Americans (76%), Black Americans (75%), and, more distantly, Native Americans (64%).
The partisan gap is largest among white Americans: 61% of white Republicans, 80% of white independents, and 88% of white Democrats favor LGBT nondiscrimination protections. The gap is smaller among Hispanic Americans: 69% of Hispanic Republicans, 77% of Hispanic independents, and 83% of Hispanic Democrats favor these protections. Sample sizes are too small for full partisan comparisons for Americans of other races and ethnicities; however, around eight in ten AAPI independents (84%), multiracial independents (79%), Black independents (74%), and Black Democrats (79%) favor nondiscrimination protections.
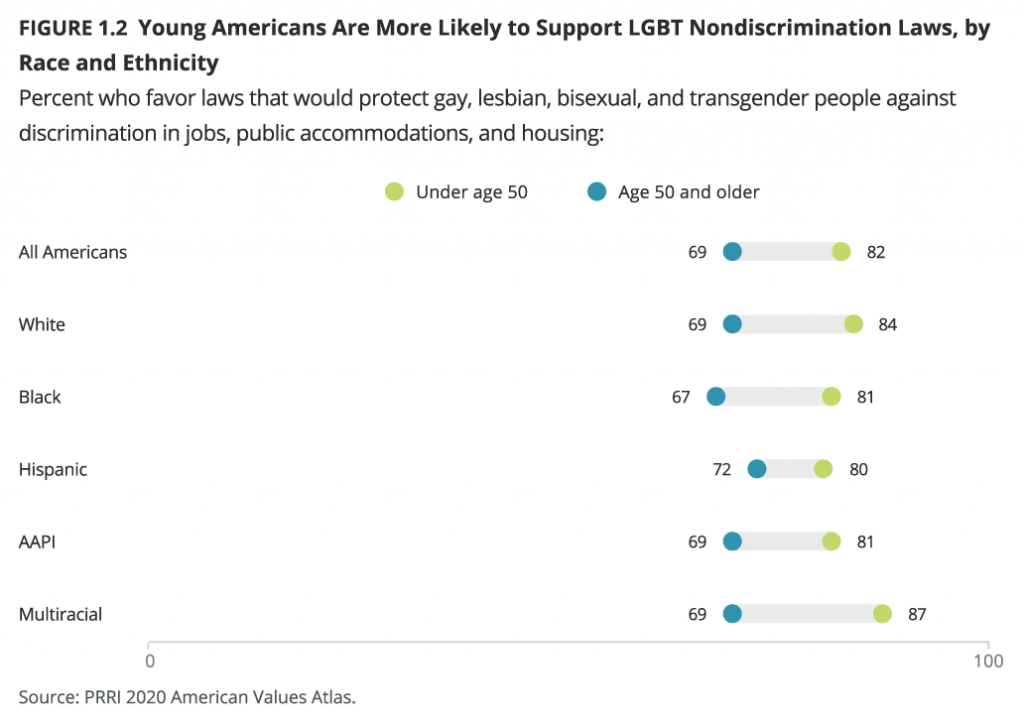
There are consistent age gaps within each racial and ethnic group. Around eight in ten Americans under age 50 in all racial and ethnic groups favor nondiscrimination protections for LGBT people. This includes 87% of multiracial Americans, 84% of white Americans, 81% of AAPI Americans, 81% of Black Americans, and 80% of Hispanic Americans. Differences among Americans over age 50 are similar: 72% of Hispanic Americans, 69% of multiracial Americans, 69% of AAPI Americans, 69% of white Americans, and 67% of Black Americans favor nondiscrimination protections.
Across racial and ethnic groups, women are slightly more likely than men to favor LGBT nondiscrimination protections. Support is highest among multiracial women (86%), while eight in ten white (80%), Hispanic (80%), and Black women (80%) favor protections for LGBT people. Around three-quarters of multiracial men (76%), AAPI men (75%), and Hispanic men (74%), and around seven in ten white men (72%) and Black men (69%), say the same.
Americans with four-year college degrees or higher are slightly more likely to support LGBT nondiscrimination protections across race and ethnicity lines. The gap is slightly larger among Black Americans (71% for those with no four-year college degree, and 85% of those with a four-year college degree or more) and white Americans (72% for those with no four-year college degree, and 84% of those with a four-year college degree or more) than it is among Hispanic Americans (76% for those with no four-year college degree, and 83% of those with a four-year college degree or more). There is no notable education gap among multiracial Americans; the level of support among those with no four-year college degree (83%) is not significantly different from that of multiracial Americans with a four-year college degree or more (78%).
Religious Affiliation
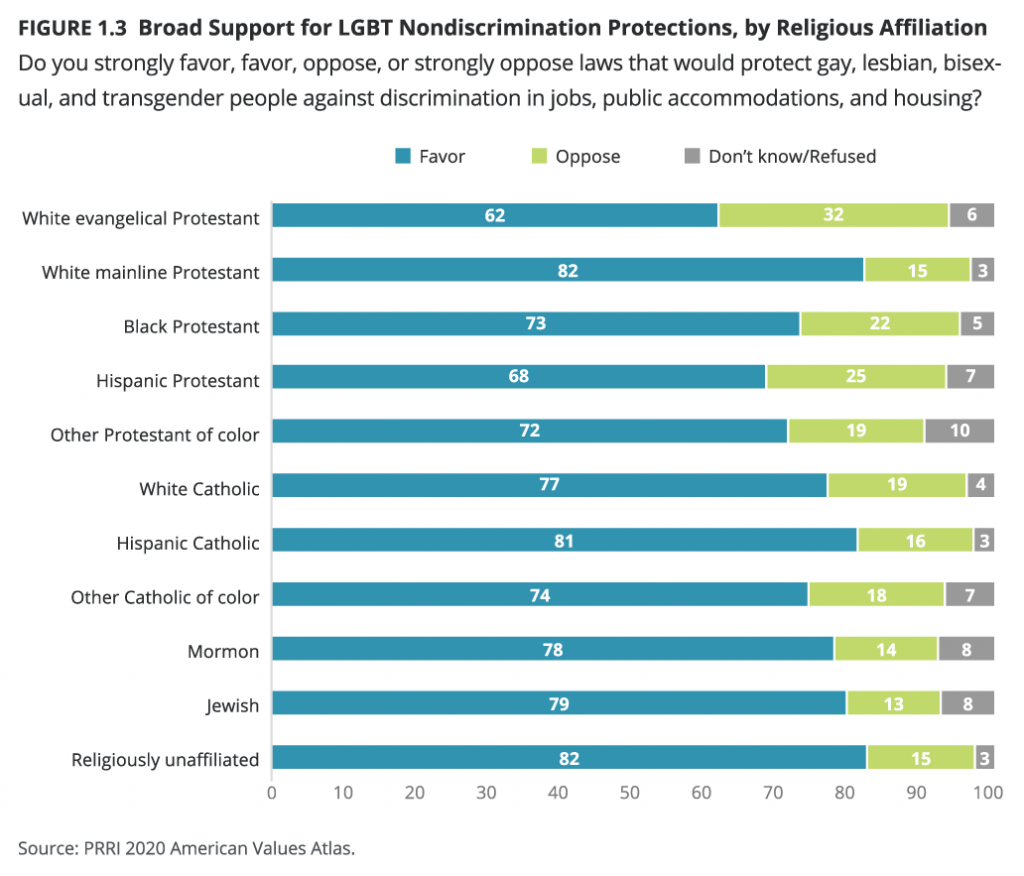
Broad majorities of all major religious groups favor nondiscrimination protections for LGBT Americans. More than six in ten members of every religious group support nondiscrimination laws.
Eight in ten or more Jewish Americans (79%), Hispanic Catholics (81%), white mainline Protestants (82%), and religiously unaffiliated Americans (82%) favor nondiscrimination protections for LGBT Americans. Around three in four Black Protestants (73%), other Catholics of color (74%), white Catholics (77%), and Mormons (78%) favor protections. Other Protestants of color (72%) and Hispanic Protestants (68%) are slightly less likely to favor nondiscrimination protections. White evangelical Protestants (62%) are least likely to favor nondiscrimination laws that protect LGBT Americans.
The largest increase in support for LGBT nondiscrimination protections among religious groups since 2019 is among other Protestants of color (from 59% to 72%). Support has also increased among white mainline Protestants (from 74% to 82%), Hispanic Catholics (from 75% to 81%), religiously unaffiliated Americans (from 78% to 82%), and white Catholics (from 74% to 77%). Other groups have not shifted significantly.
Religious divides are particularly notable among the Hispanic Protestant community in America. Those who identify as born again or evangelical (62%) are considerably less likely than those who do not (81%) to support nondiscrimination protections.[1] Hispanic religiously unaffiliated Americans (80%) also show very strong support.
Among all Americans who identify as evangelical or born again, there are significant differences by race and ethnicity. Black evangelical Protestants (70%) and other evangelical Protestants of color (66%) are more likely than white evangelical Protestants (62%) and Hispanic evangelical Protestants (62%) to favor nondiscrimination protections for LGBT Americans.
Younger members of religious groups who are under age 50 are more likely than their older counterparts to favor LGBT nondiscrimination laws. The gap is larger among white evangelical Protestants (73% of those under age 50, 56% of those over age 50), other Protestants of color (80% of those under age 50, 61% of those over age 50), Black Protestants (80% of those under age 50, 66% of those over age 50), and white mainline Protestants (88% of those under age 50, 75% of those over age 50). The gap is around eleven percentage points or less among white Catholics (83% of those under age 50, 72% of those over age 50), Hispanic Protestants (71% of those under age 50, 62% of those over age 50), Hispanic Catholics (84% of those under age 50, 75% of those over age 50), and religiously unaffiliated Americans (86% of those under age 50, 76% of those over age 50).
Geography
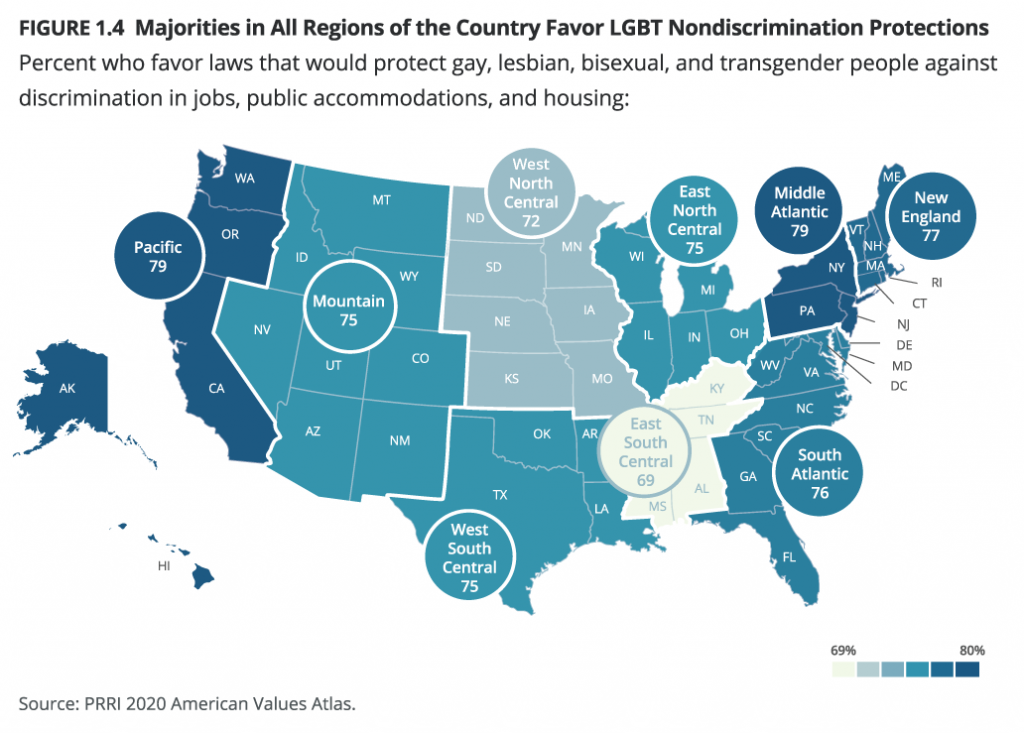
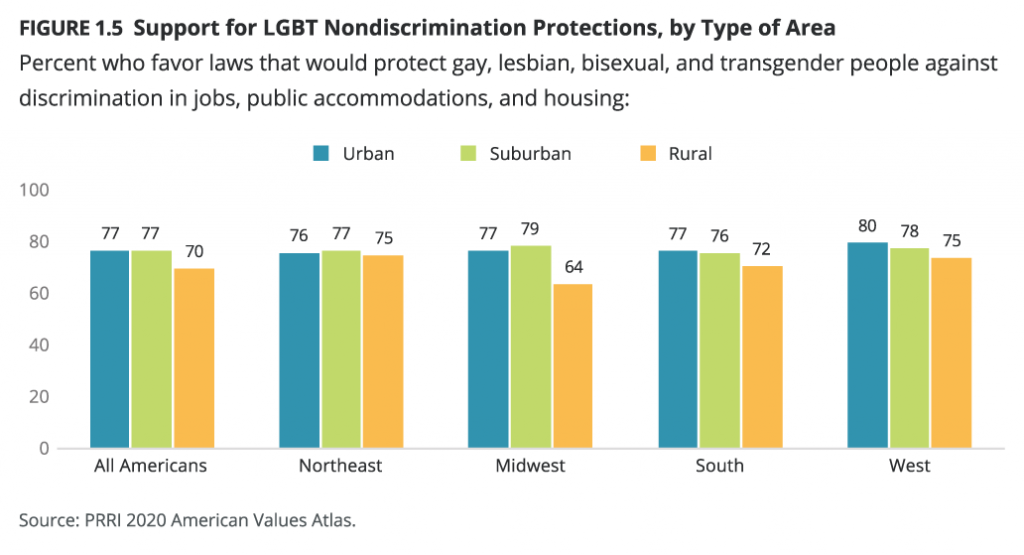
Geographic differences in support for LGBT nondiscrimination laws are relatively small. Three in four or more Americans in the Pacific (79%), Mid Atlantic (79%), New England (77%), South Atlantic (76%), East North Central (75%), West South Central (75%), and Mountain (75%) divisions favor nondiscrimination protections, along with around seven in ten Americans in the West North Central (72%) and East South Central (69%) divisions.
Americans who live in urban areas (77%) and suburban areas (77%) are somewhat more likely than those who live in rural areas (70%) to favor nondiscrimination protections. Americans in the Midwest are most likely to be divided along rural and non-rural lines: Rural residents (64%) are substantially less likely than suburban (79%) and urban residents (77%) to support nondiscrimination protections for LGBT people. Rural residents of the South (72%) and the West (75%) are only slightly less likely than their suburban (76% and 78%, respectively) and urban peers (77% and 80%, respectively) to support nondiscrimination protections. Rural residents of the Northeast (75%) are not significantly different from suburban (77%) or urban residents (76%) in the region.
Increased Opposition to Refusing Service to Gay and Lesbian People on Religious Grounds
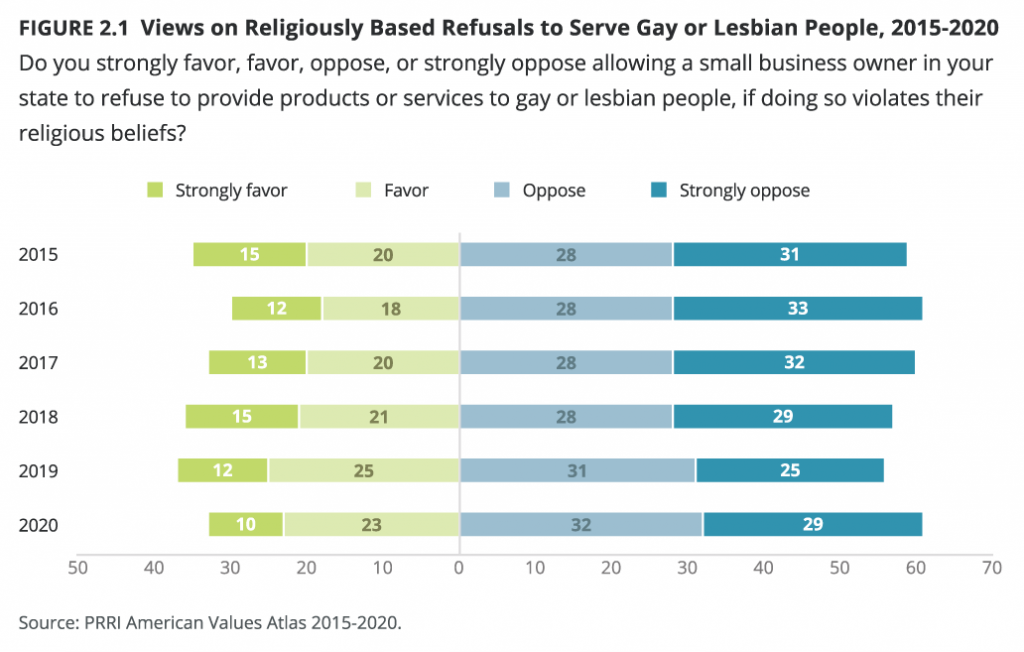
From 2016 to 2019, Americans’ opposition to allowing small businesses to refuse products or services to gay or lesbian people if doing so violates their religious beliefs declined, from 61% in 2016 to 56% in 2019. This trend reversed itself in 2020, with 61% of Americans opposing such religiously based refusals, bringing opposition back up to 2016 levels. One-third of Americans (33%) favor allowing a small business to refuse service to gay and lesbian people if doing so violates their religious beliefs.
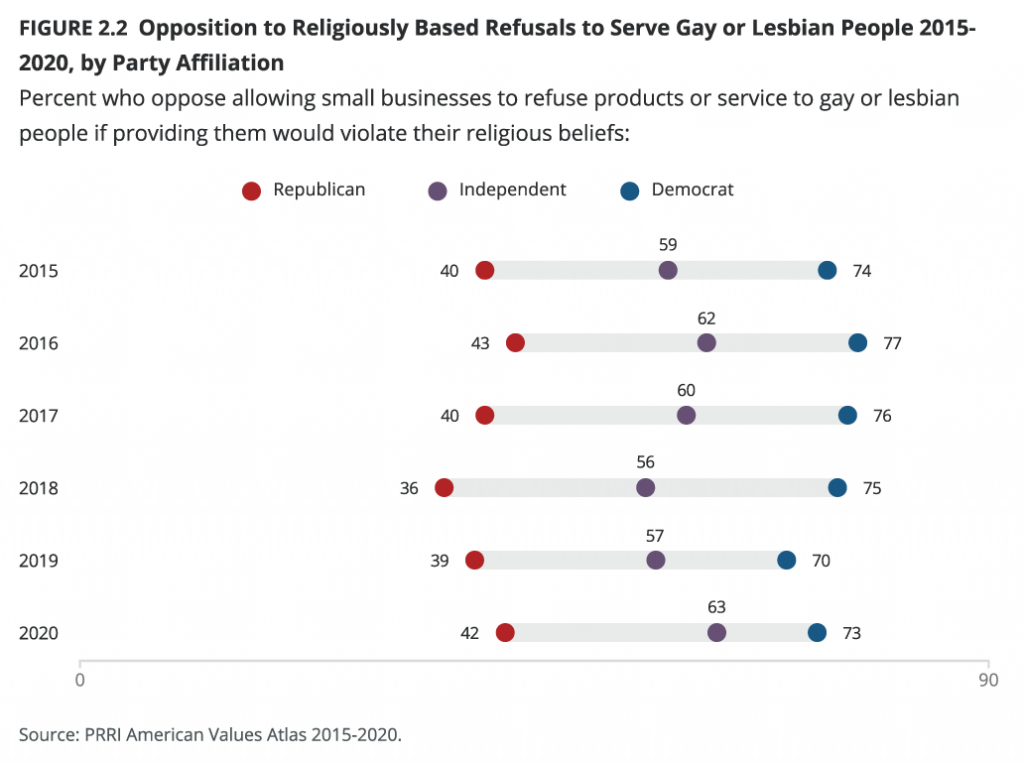
Just over four in ten Republicans (42%) oppose allowing small businesses to refuse to serve gay and lesbian people for religious reasons, slightly up from 39% in 2019, 36% in 2018, and 40% in 2017, but on par with their opposition levels in 2016. Independents have reached a new high in opposition, however, with more than six in ten (63%) opposing such service refusals, slightly above their last high mark, of 62% in 2016. After hitting a low point of 70% opposition in 2019, Democrats have rebounded a bit, to 73% opposing allowing a small business to refuse products or services to gay or lesbian people if doing so violates their religious beliefs. This is not quite up to Democrats’ 2016 level of opposition (77%).
White evangelical Protestants (46%) are the only religious group in which less than a majority opposes allowing small business to refuse service to gay and lesbian people on religious grounds. Majorities of white Catholics (60%) and white mainline Protestants (59%) oppose such refusals, as do 54% of Hispanic Protestants, 56% of Protestants who are multiracial or another race, and 70% of Black Protestants.
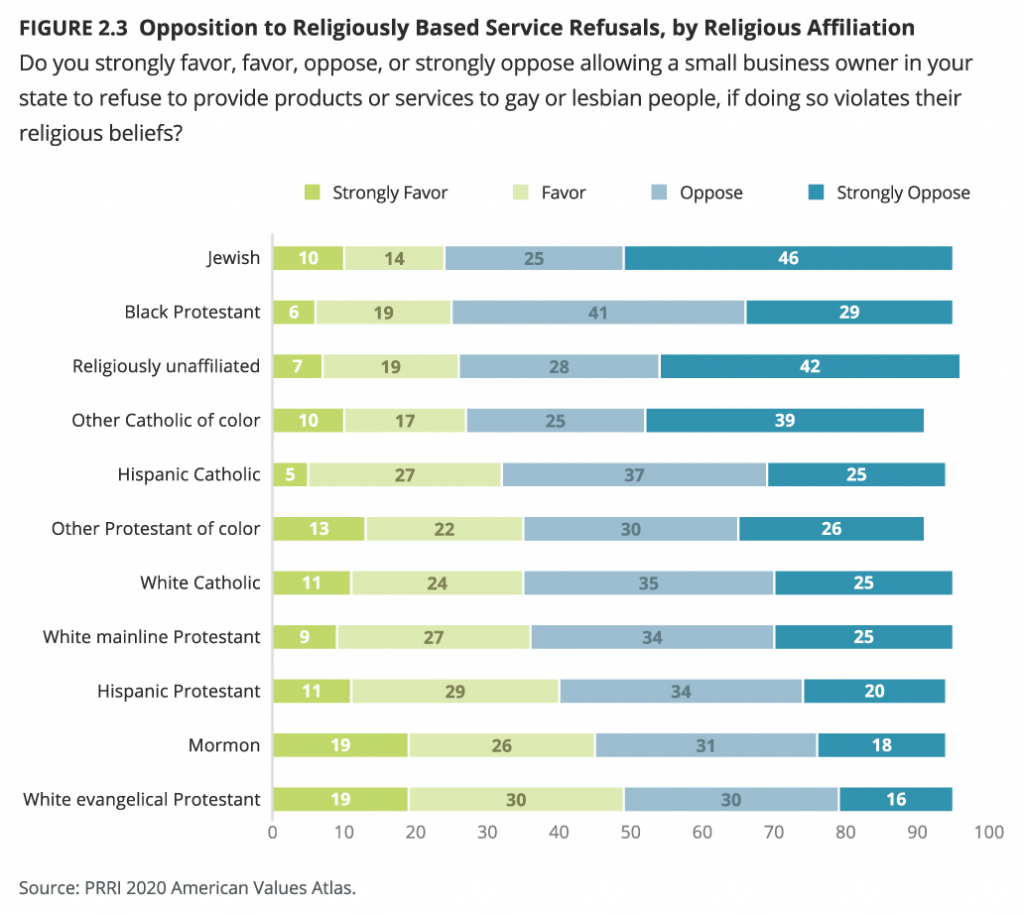
Again, there are divisions among evangelical Protestants by race. Hispanic evangelical Protestants (50%), other evangelical Protestants of color (48%), and white evangelical Protestants (46%) are less likely than Black evangelical Protestants (70%) to oppose religiously based refusals to serve gay or lesbian people. About two-thirds of religiously unaffiliated Americans (70%) and non-Christian religious Americans (65%) oppose allowing small businesses to refuse products or services to gay or lesbian people if doing so violates their religious beliefs.
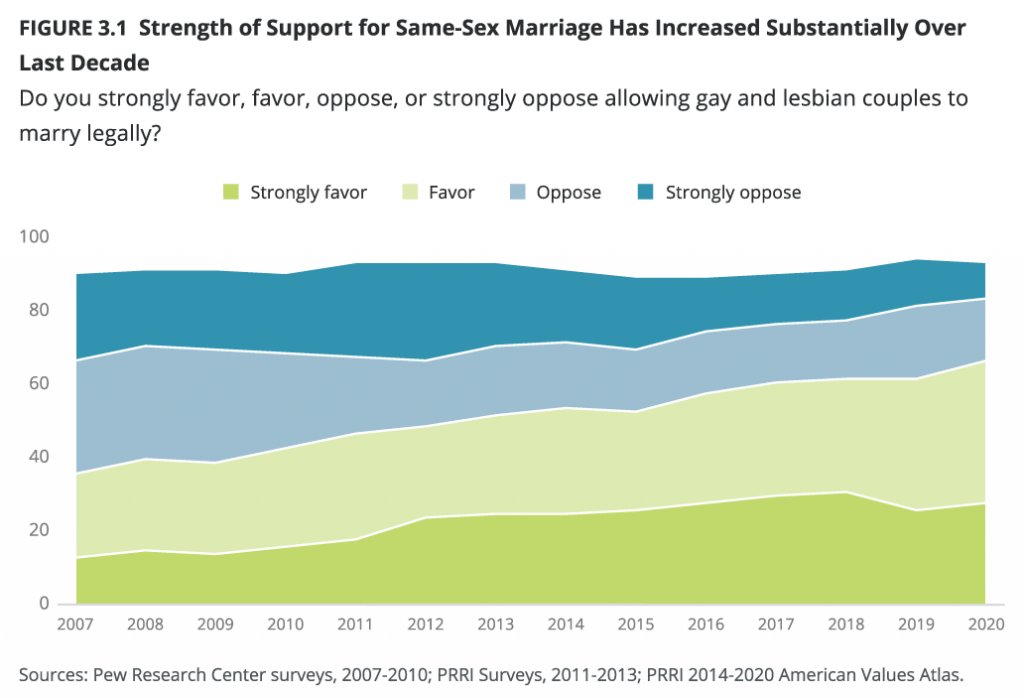
Two-thirds of Americans Support Same-Sex Marriage
After settling in the low 60s in the last three years, support for allowing gay and lesbian couples to marry legally has increased, to 67% in 2020. That is a significant increase from 62% in 2019 and 2018 and 61% in 2017. Support for same-sex marriage has ballooned from just 36% in 2007 to two-thirds today, and opposition has dropped from 55% to 27%.
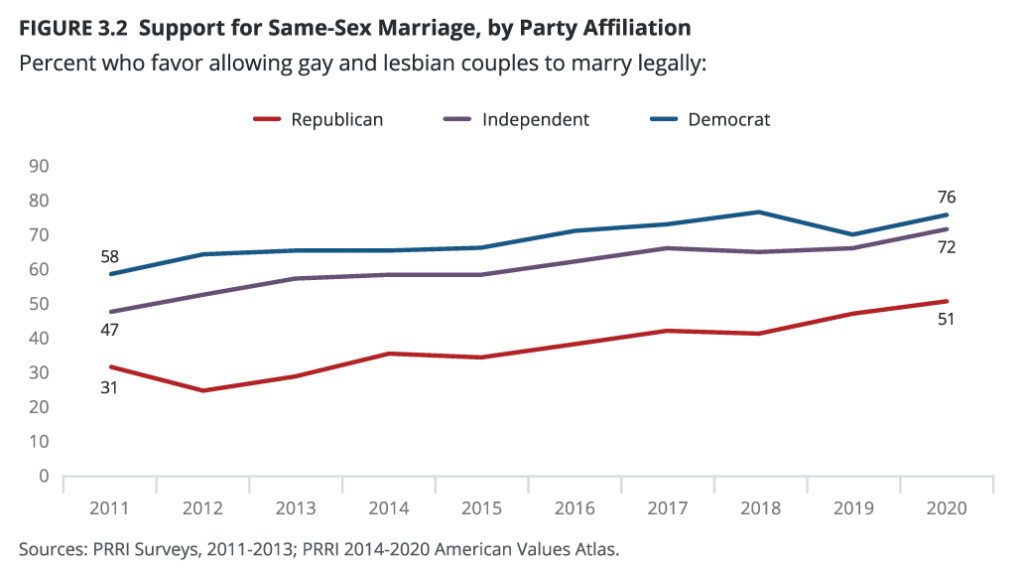
For the first time, in 2020, a slim majority of Republicans (51%) support allowing gay and lesbian couples to legally marry, up from 47% support in 2019. Independents are also at a new high point, with 72% support, up from the mid-60s in the past few years. More than three in four Democrats (76%) support same-sex marriage, up from 70% in 2019 but similar to 77% in 2018.
Majorities of most religious groups support same-sex marriage, including more than seven in ten non-Christian religious Americans (76%), white Catholics (75%), white mainline Protestants (72%), and Hispanic Catholics (71%); as do 81% of religiously unaffiliated Americans. Majorities of Black Protestants (57%), other Protestants of color (56%), and Hispanic Protestants (51%) support same-sex marriage, but support drops below half among white evangelical Protestants (43%).
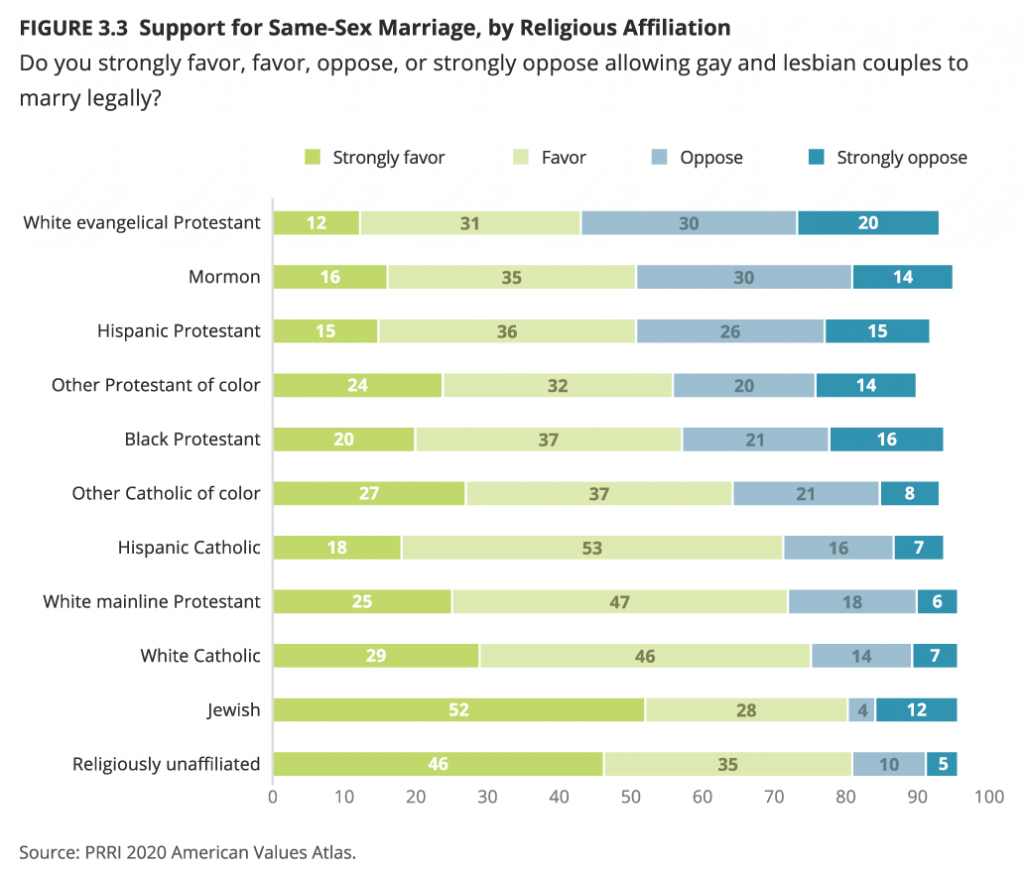
Interestingly, there are not large differences among evangelical Protestants by race on this question. In addition to white evangelical Protestants (43%), about four in ten multiracial and evangelical Protestants of another race (43%) and Hispanic evangelical Protestants (41%) support same-sex marriage, and just under half of Black evangelical Protestants (49%) say the same.
Who Still Opposes LGBTQ Rights Policies?
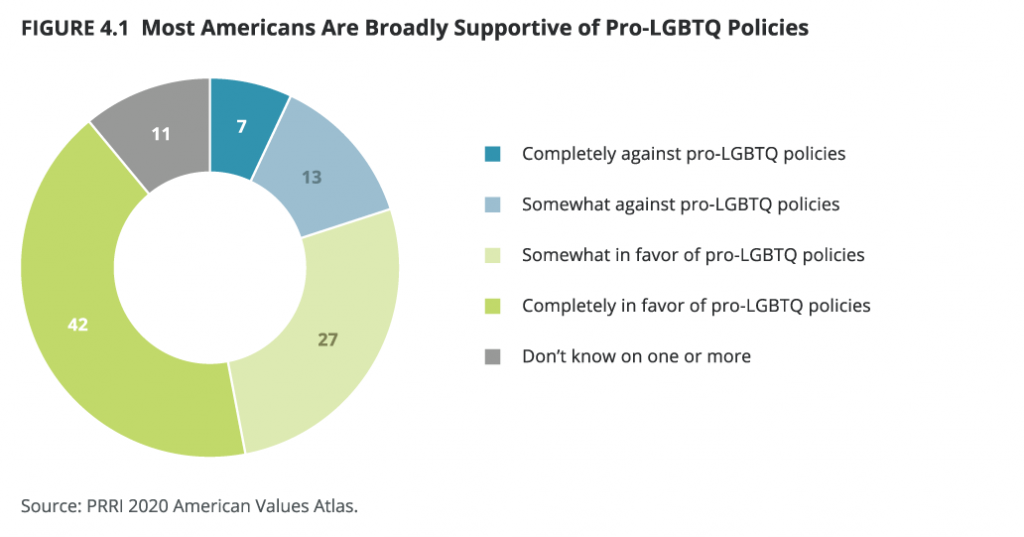
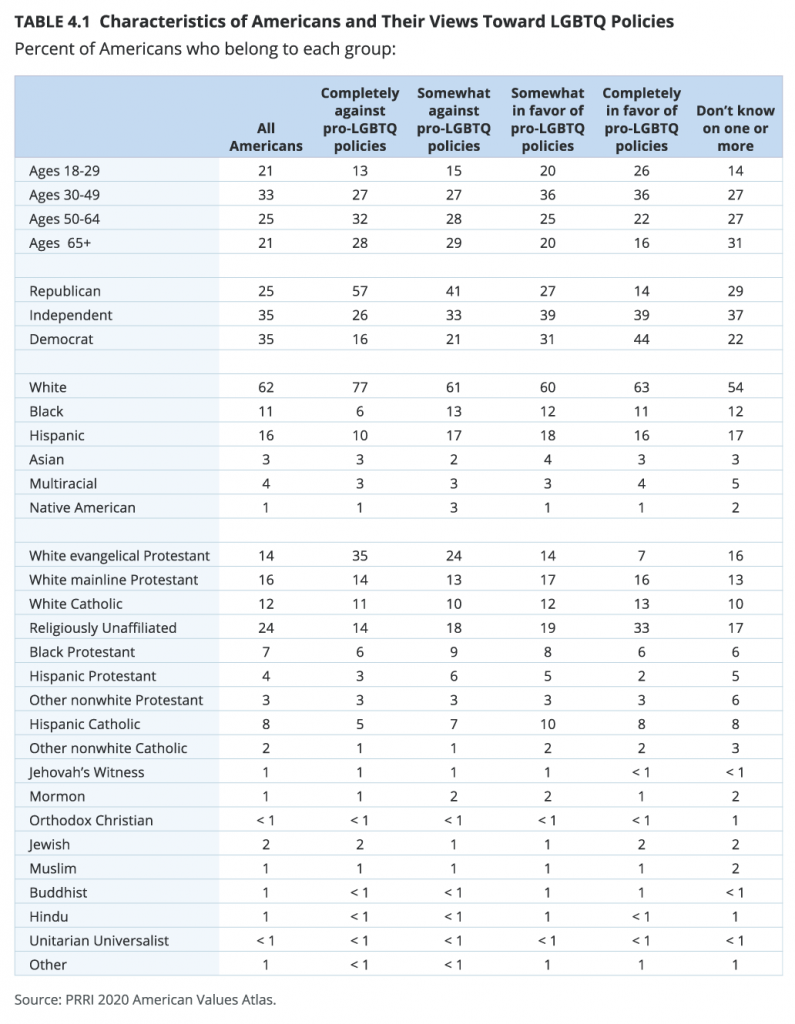
PRRI constructed an index of unfavorable views toward LGBTQ policies, including opposition to same-sex marriage, opposition to non-discrimination laws, and support for service refusals. Each of the index’s five groups is described as follows: Completely against pro-LGBTQ policies (oppose same-sex marriage, oppose non-discrimination laws, favor service refusals), somewhat against pro-LGBTQ policies (any two of three: oppose same-sex marriage, oppose non-discrimination laws, favor service refusals), somewhat in favor of LGBTQ policies (any two of three: favor same-sex marriage, favor non-discrimination laws, oppose service refusals), completely in favor of LGBTQ policies (favor same-sex marriage, favor non-discrimination laws, oppose service refusals), and don’t know on one or more.
Only one in five Americans (20%) show unfavorable opinions toward LGBTQ policies on at least two of the three questions. Specifically, 7% of Americans are in the completely against category, while 13% of Americans are in the somewhat against category. By contrast, the majority of Americans show favorable opinions (69%), including more than four in ten Americans (42%) who completely favor pro-LGBTQ policies and 27% who somewhat favor them. Finally, 11% of Americans declined to answer or said they did not know their opinion on one or more of the three policies.
Characteristics of Those Completely Against Pro-LGBTQ Policies
Those who are completely against pro-LGBTQ policies are older, more likely to be Republicans, feel more favorably toward former president Donald Trump, and are more likely to be white and white Christian than the American population and those who are in favor of these pro-LGBTQ policies.
Of the 7% of Americans who are completely against pro-LGBTQ policies, 40% are under the age of 50 and 60% are 50 or older. The youngest Americans comprise only 13% of this category, compared to 27% of those ages 30 to 49, 32% of those ages 50 to 64, and 28% of those ages 65 and over.
Not surprisingly, a majority of those most opposed to LGBTQ rights identify as Republicans (57%), compared to 26% who identify as independent and 16% who are Democrats. The vast majority who completely oppose pro-LGBTQ policies rate former president Donald Trump favorably (75%), including 46% who hold very favorable opinions of Trump. Only one in four Americans in this category (25%) view Trump unfavorably.
Among those who are completely against pro-LGBTQ policies, nearly eight in ten are white (77%), 10% are Hispanic, 6% are Black, 3% are Asian American, 3% are multiracial, and 1% are Native Americans.
White Christians make up 60% of those who are completely against pro-LGBTQ policies. This includes more than one-third who are white evangelical Protestant (35%), 14% who are white mainline Protestant, and 11% who are white Catholic. Smaller proportions are Christians of color or belong to non-Christian religions: 6% are Black Protestants, 5% are Hispanic Catholics, 3% are Hispanic Protestants, 3% are other Protestants of color, 2% are Jewish Americans, 1% are other Catholics of color, and 1% are Muslim Americans. Finally, 14% are religiously unaffiliated.
Methodology and Footnotes
The 2020 American Values Atlas (AVA) is a project of PRRI. Results for all demographic, religious affiliation, and political affiliation questions were based on 50,334 bilingual telephone interviews (including 35,212 cell phone interviews) conducted between January 7, 2020 and December 20, 2020 by professional interviewers under the direction of SSRS. National results for questions on specific issues are based on a subset of 10,052 telephone interviews (including 6,981 cell phone interviews) conducted in 10 weeks spread across the year. State level results for questions on specific issues are based on the national subset plus an oversample of 10 key states in 30 additional weeks, resulting in 23,536 interviews across all 50 states plus the District of Columbia (including 16,848 cell phone interviews). Key states include Arizona, California, Florida, Georgia, Michigan, North Carolina, New Mexico, Ohio, Texas, and Utah. The survey was made possible by generous support from the Arcus Foundation, the Evelyn and Walter Haas, Jr. Fund, the Gill Foundation, and Unitarian Universalist Veatch Program at Shelter Rock.
Throughout 2020, at least 1,000 interviews were completed each week, with about 700 interviews conducted among respondents on their cell phones. Each week, interviewing occurred over a five- or six-day period, starting Tuesdays or Wednesdays and going through Sunday or Monday. The selection of respondents within households was accomplished by randomly requesting to speak with the youngest adult male or female currently living in the household.
Data collection was based on stratified, single-stage, random-digit-dialing (RDD) of landline telephone households and randomly generated cell phone numbers. The sample was designed to represent the total U.S. adult population from all 50 states, including Hawaii and Alaska, and the District of Columbia. The landline and cell phone samples were provided by Marketing Systems Group.
The weighting was accomplished in two separate stages. The first stage of weighting corrects for different probabilities of selection associated with the number of adults in each household and each respondent’s telephone usage patterns. In the second stage, sample demographics were balanced to match target population parameters for gender, age, education, race and Hispanic ethnicity, region (U.S. Census definitions), population density, and telephone usage. The population density parameter was derived from 2010 Census data. The telephone usage parameter came from an analysis of the January-June 2018 National Health Interview Survey. All other weighting parameters were derived from an analysis of the U.S. Census Bureau’s March 2018 Current Population Survey.
The sample weighting was accomplished using iterative proportional fitting (IFP), a process that simultaneously balances the distributions of all variables. Weights are trimmed so that they do not exceed 4.0 or fall below 0.25 to prevent individual interviews from having too much influence on the final results. The use of these weights in statistical analysis ensures that the demographic characteristics of the sample closely approximate the demographic characteristics of the target populations.
The table below shows the sample sizes for all 50 states for both sample and issue subsample. The margin of error for the total sample is +/- 0.5 percentage points at the 95% level of confidence. The margin of error for the national issue subsample is +/- 1.1 percentage points at the 95% level of confidence. The design effect of 1.3 is included in the margins of error. In addition to sampling error, surveys may also be subject to error or bias due to question wording, context, and order effects.
| Table 1: State Sample Sizes | ||
| State | Total Sample | Issue Subsample |
| United States | 50,334 | 10,052 |
| U.S. plus 10 state oversamples | 50,334 | 23,536 |
| Alabama | 753 | 152 |
| Alaska | 186 | 29 |
| Arizona | 1,126 | 888 |
| Arkansas | 439 | 85 |
| California | 5,415 | 4,474 |
| Colorado | 991 | 192 |
| Connecticut | 521 | 115 |
| Delaware | 192 | 61 |
| District of Columbia | 226 | 74 |
| Florida | 3,613 | 2,918 |
| Georgia | 1,770 | 1,495 |
| Hawaii | 176 | 59 |
| Idaho | 349 | 63 |
| Illinois | 1,577 | 295 |
| Indiana | 1,083 | 217 |
| Iowa | 528 | 108 |
| Kansas | 425 | 82 |
| Kentucky | 711 | 147 |
| Louisiana | 549 | 114 |
| Maine | 214 | 46 |
| Maryland | 1,037 | 195 |
| Massachusetts | 1,017 | 195 |
| Michigan | 1,670 | 1,357 |
| Minnesota | 886 | 164 |
| Mississippi | 286 | 58 |
| Missouri | 816 | 144 |
| Montana | 254 | 29 |
| Nebraska | 348 | 68 |
| Nevada | 492 | 109 |
| New Hampshire | 238 | 62 |
| New Jersey | 1,344 | 288 |
| New Mexico | 397 | 316 |
| New York | 3,079 | 586 |
| North Carolina | 1,730 | 1,421 |
| North Dakota | 151 | 46 |
| Ohio | 1,894 | 1,549 |
| Oklahoma | 529 | 112 |
| Oregon | 839 | 176 |
| Pennsylvania | 2,053 | 399 |
| Rhode Island | 139 | 40 |
| South Carolina | 944 | 183 |
| South Dakota | 144 | 53 |
| Tennessee | 1,005 | 209 |
| Texas | 3,440 | 2,808 |
| Utah | 554 | 448 |
| Vermont | 115 | 39 |
| Virginia | 1,555 | 299 |
| Washington | 1,310 | 309 |
| West Virginia | 296 | 51 |
| Wisconsin | 823 | 168 |
| Wyoming | 105 | 41 |
[1] The sample size for Hispanic non-evangelical Protestants is n=88; however, the difference compared to Hispanic evangelical Protestants is statistically significant, despite the small sample size.
Despite Partisan Rancor, Americans Broadly Support LGBTQ Rights: Findings from the 2020 American Values Atlas” PRRI (March 23, 2021) https://www.prri.org/research/despite-partisan-rancor-despite-partisan-rancor-americans-broadly-support-lgbtq-rights-broadly-support-lgbtq-rights/